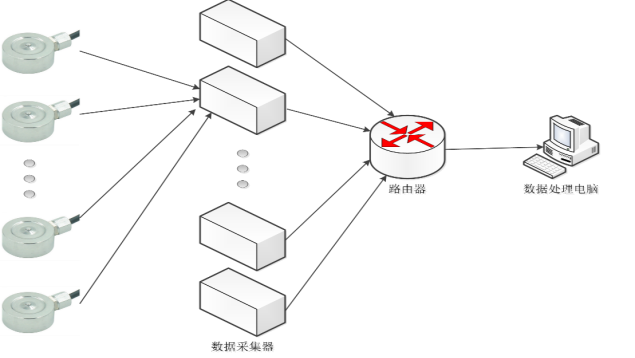
This system uses strain-based force sensors in conjunction with a dedicated fixture to measure the expansion force of battery cells. The analog signals from the force sensors are converted to digital signals through an A/D converter and then stored in a data acquisition device. The force data can be obtained in real-time on the PC through Ethernet connection to the data acquisition device, allowing for monitoring, statistical analysis, and backup of the data.
2. Device Technical Specifications
2.1 Device Functions
This device can be equipped with different accessories to perform internal pressure and expansion force testing on both soft pack and aluminum shell batteries. By using different specifications of pressure sensors and fixtures of various sizes, along with the pressure-holding fixture equipment, the device can meet the requirements for testing the expansion force of aluminum shell battery cells.
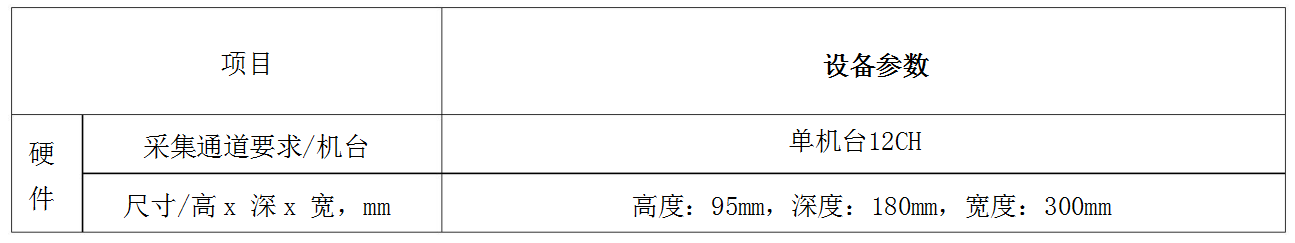
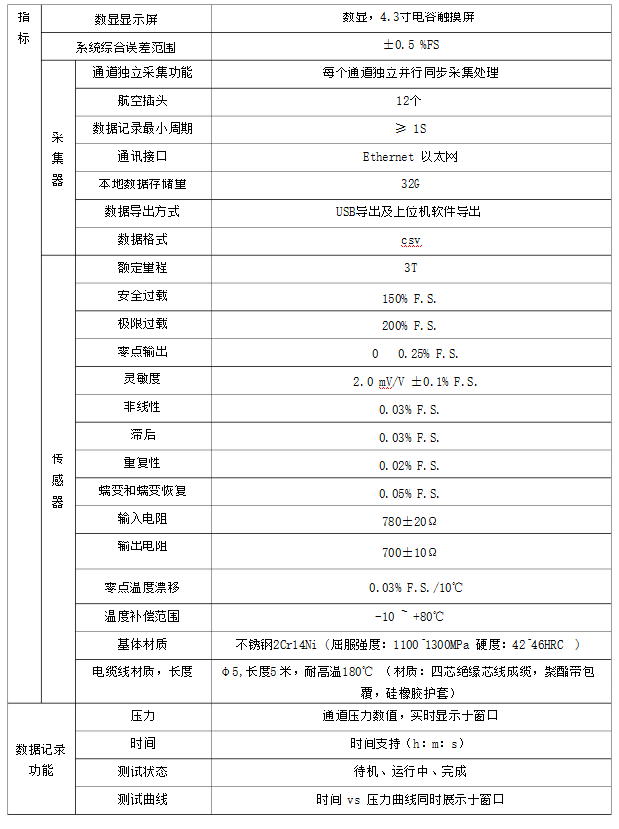
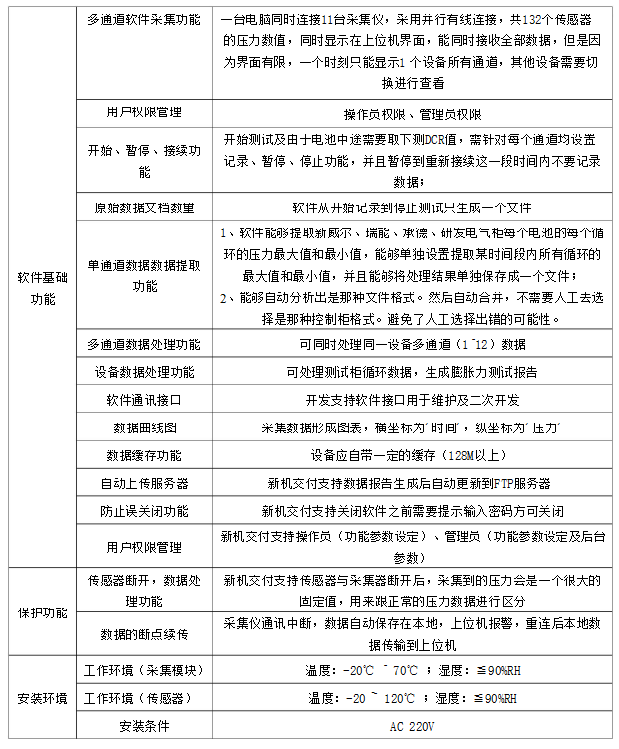
2.2 Device Technical Specifications
3. Device Hardware Description
3.1 Product Appearance and Dimensions
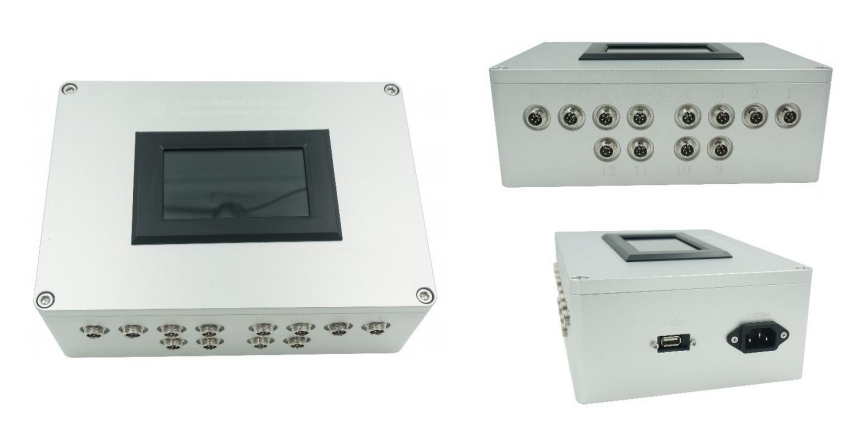
3.1.1 Product Appearance
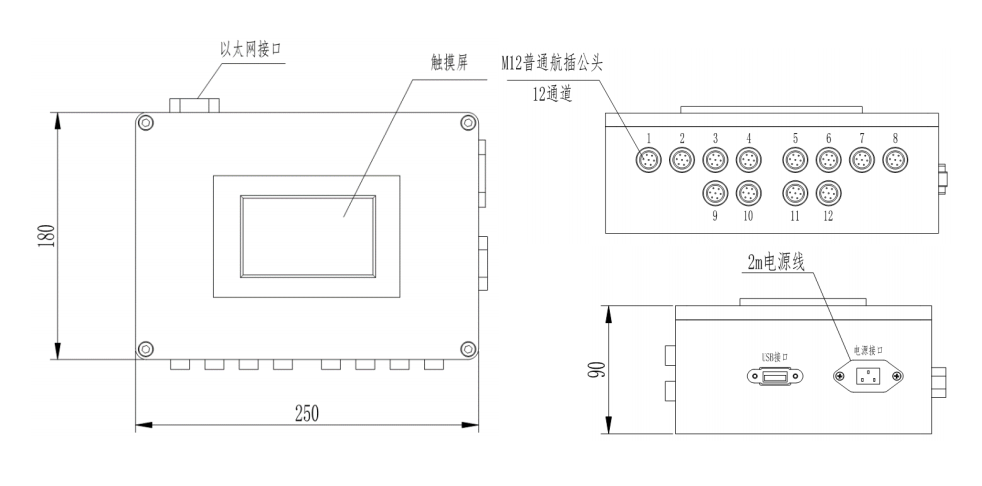
3.1.2 Product Dimensions
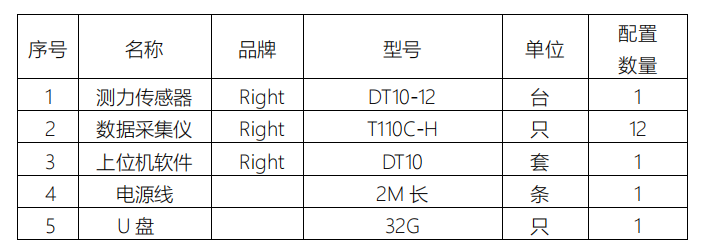
3.2 Device Configuration:
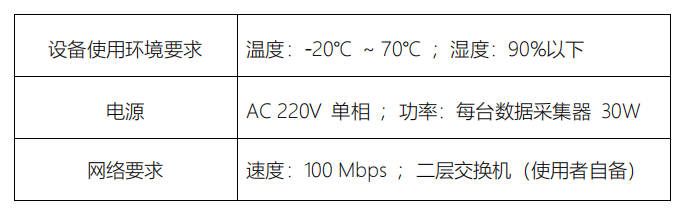
3.3 Device Installation Requirements:
4. User Manual for Data Acquisition Software
4.1 Quick Configuration Steps
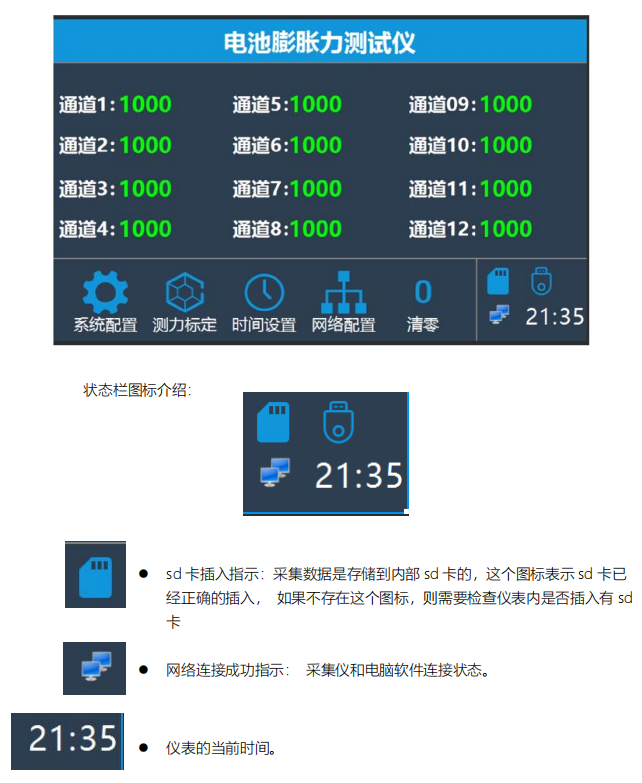
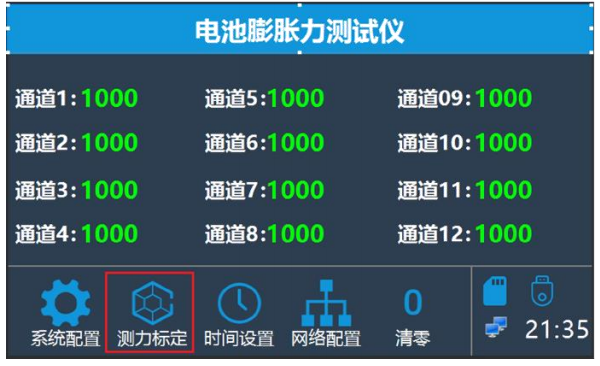
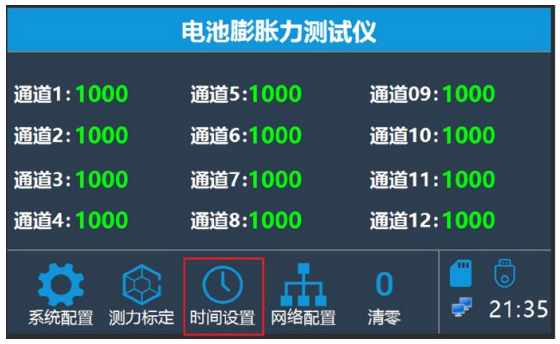
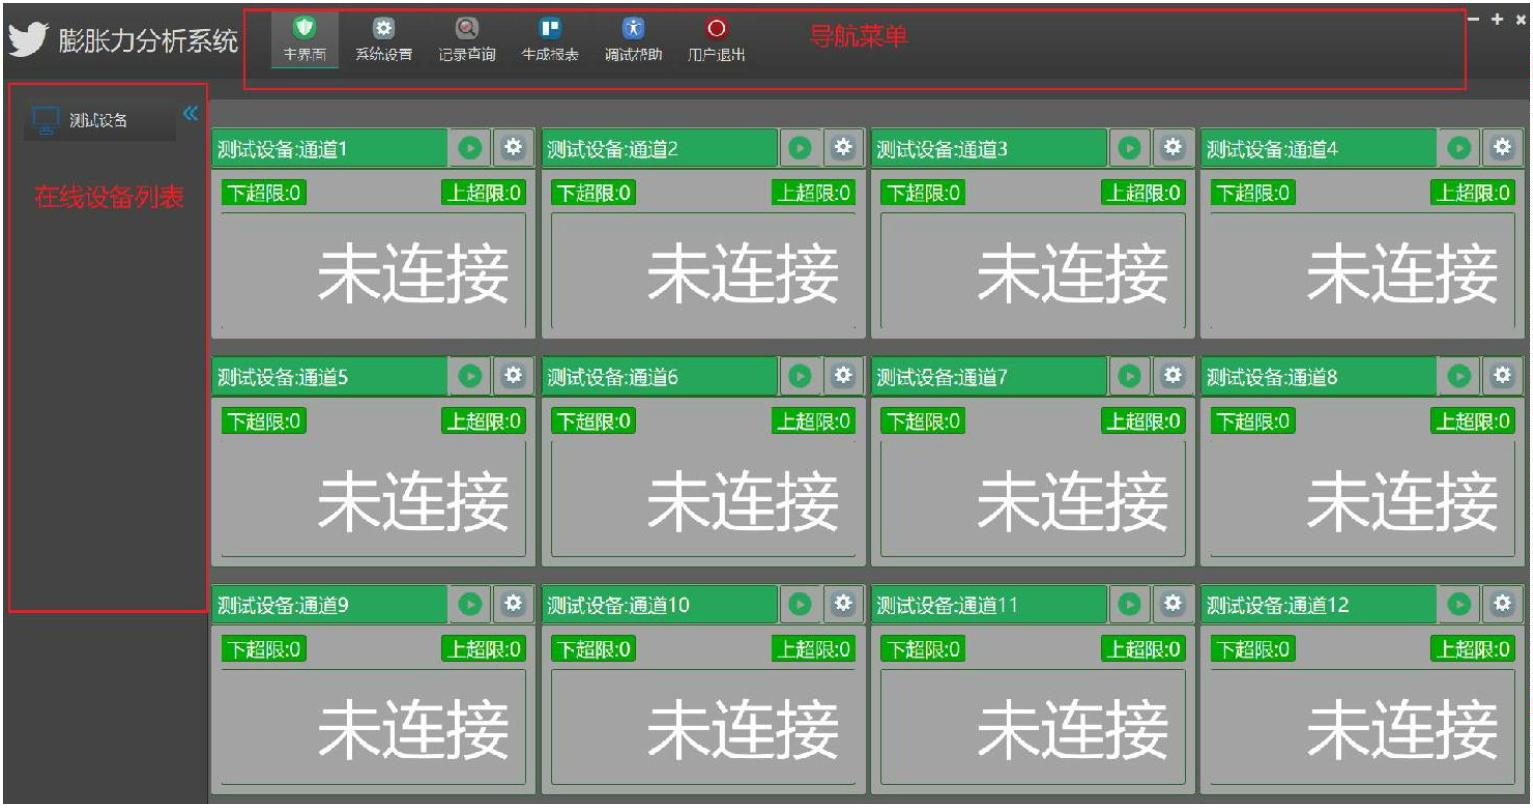
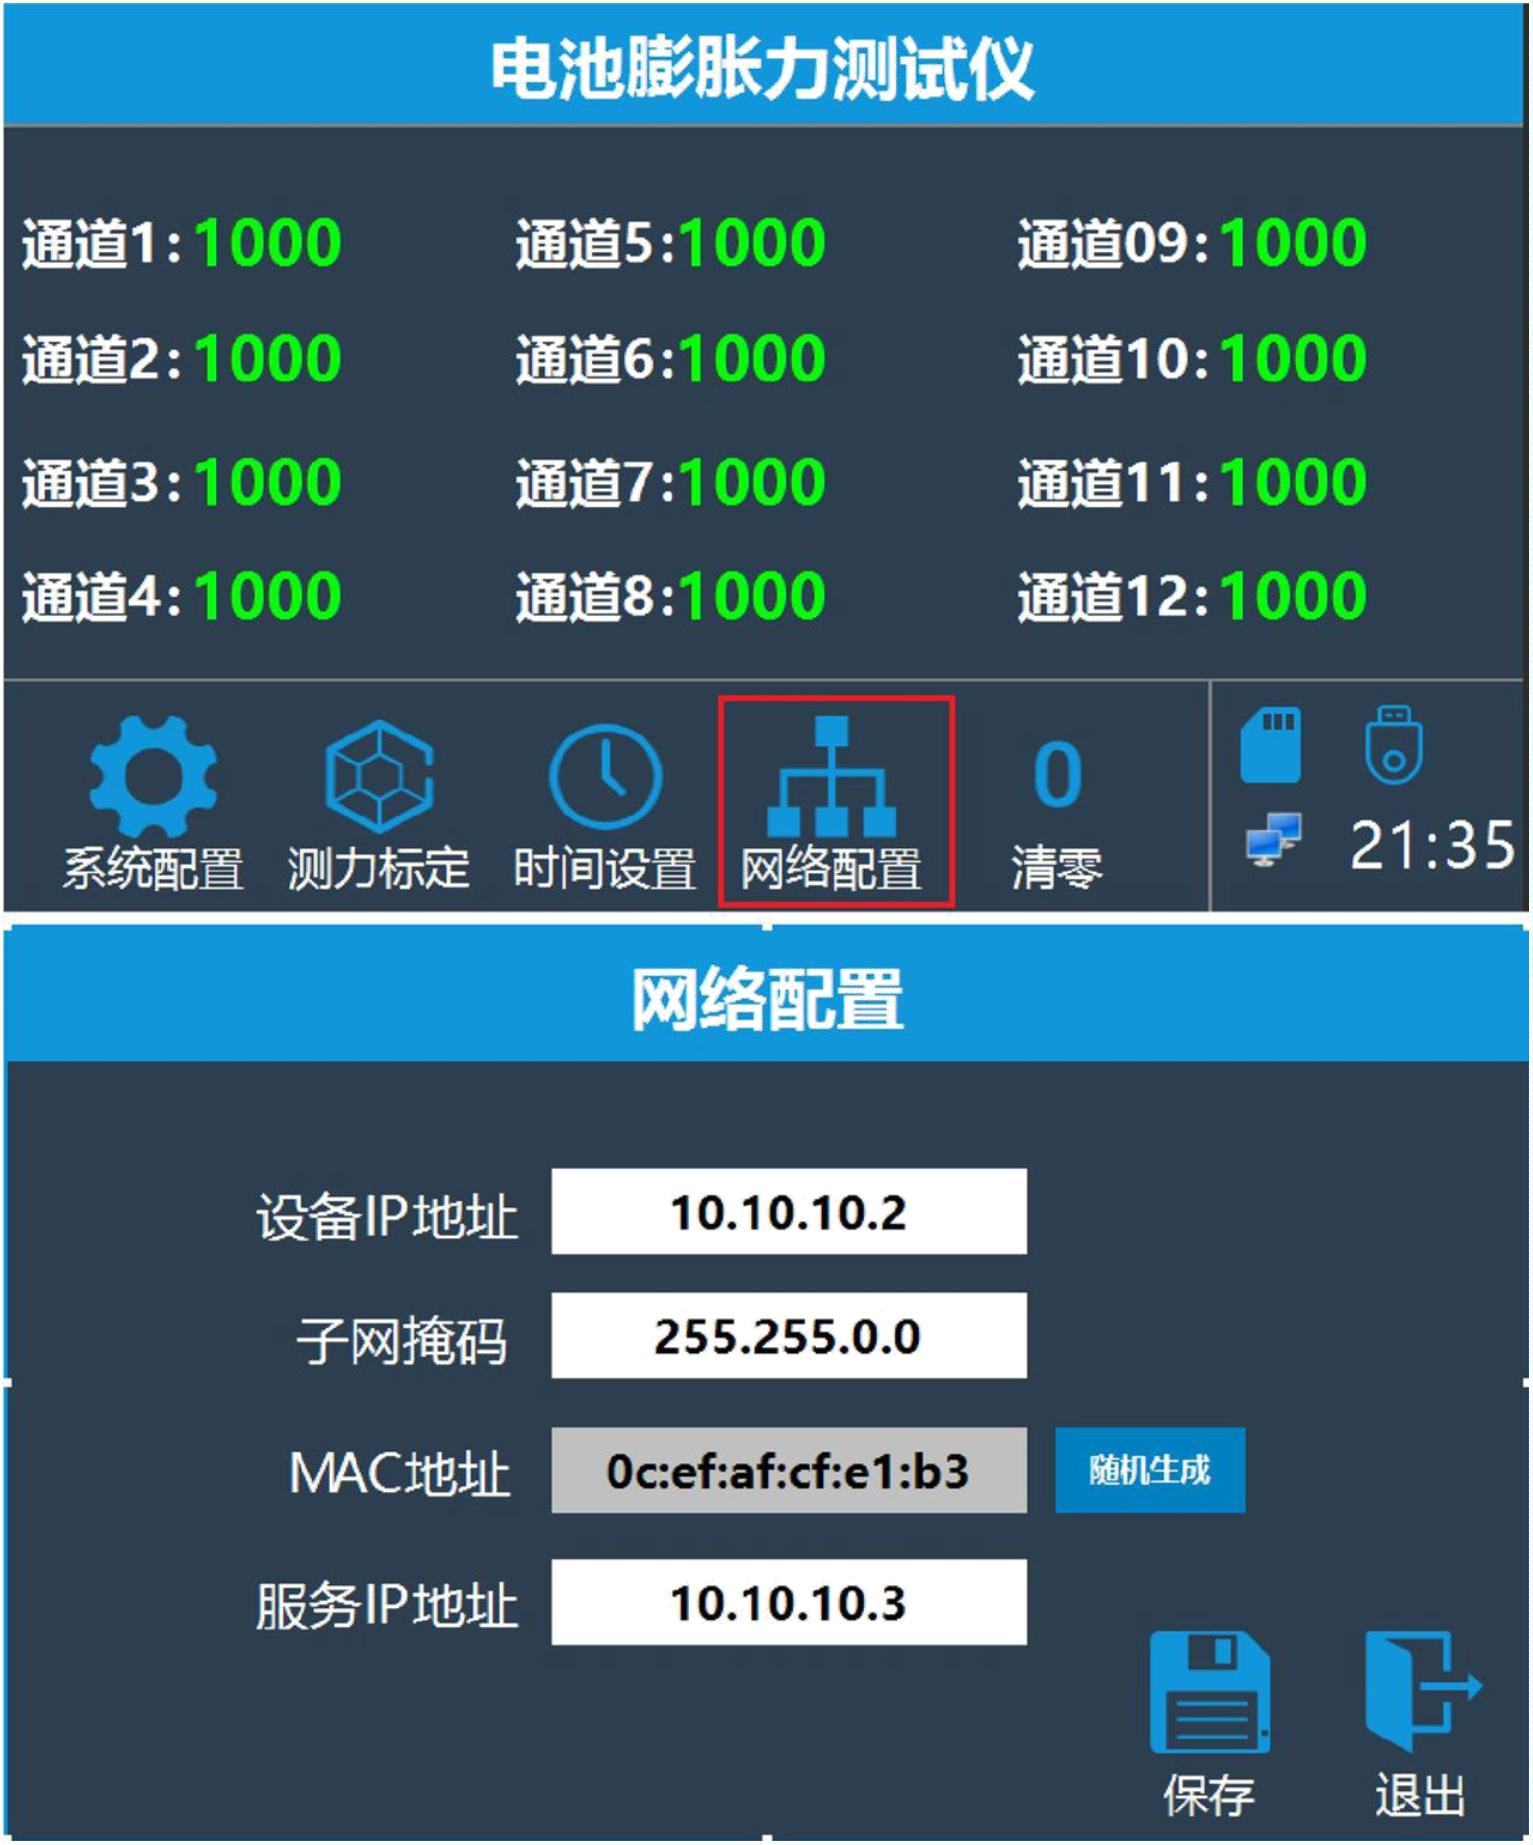
After starting the data acquisition device, it will automatically enter the main weighing interface, displaying 8 channels of expansion force measurement values and the operation menu.
4.2 Network Communication Configuration
The force data acquisition device transfers pressure data to the PC via Ethernet. Therefore, the network communication parameters between the data acquisition device and the PC need to be configured first. On the main interface of the data acquisition device, click the "Network Configuration" button to enter the network configuration menu.
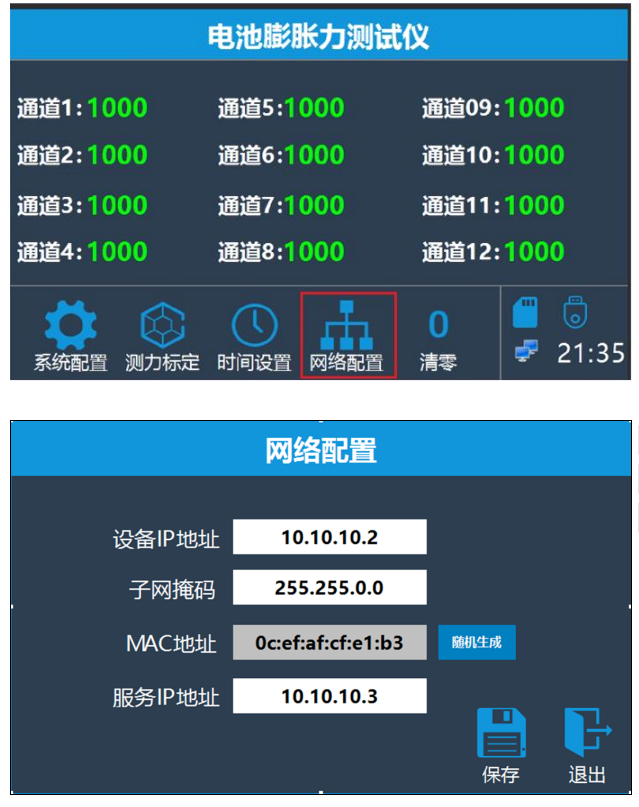
The parameters that need to be configured are as follows:
Device IP Address: The IP address of the expansion force data acquisition device itself (should be in the same network subnet as the IP address of the PC).
Subnet Mask: The subnet mask of the expansion force data acquisition device itself (should be the same as the subnet mask of the PC).
MAC Address: The MAC address of the expansion force data acquisition device itself. Each device has a unique address, which is already configured during the manufacturing process. In general, manual configuration is not required as the MAC address is already set.
Server IP Address: The IP address of the PC where the upper computer software is installed. It should be able to ping the device IP address from the PC.
After configuring the parameters, click on "Save". The data acquisition device will automatically restart the software. After about 5 seconds, the software will be ready.
Startup completed.
Clicking on "Exit" will not save the network parameters.
4.2.1 Verify successful communication between the host computer and the data collector.
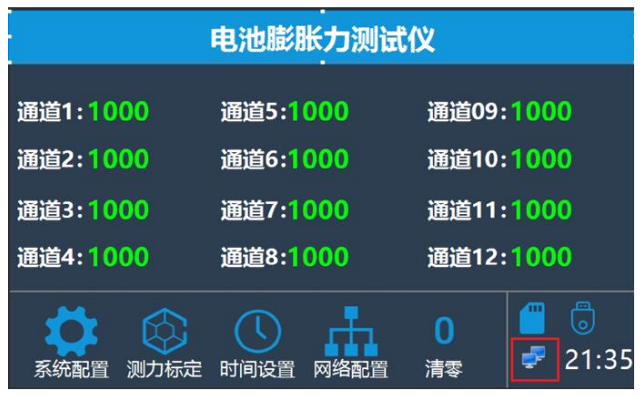
1. There is a network connection icon located at the bottom right corner of the main interface of the data collector.
Disconnected icon is as follows.

The network has been successfully connected.
4.3 Configure data collection parameters.
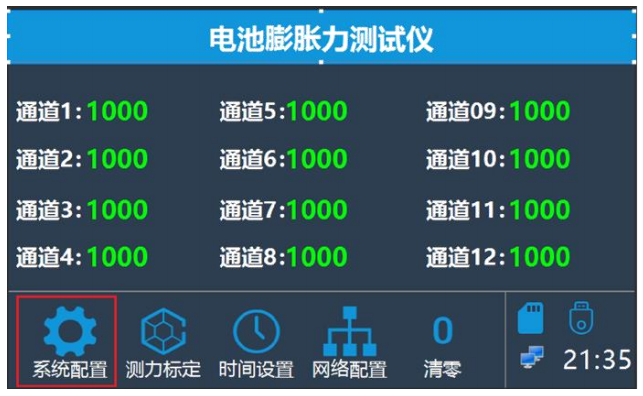
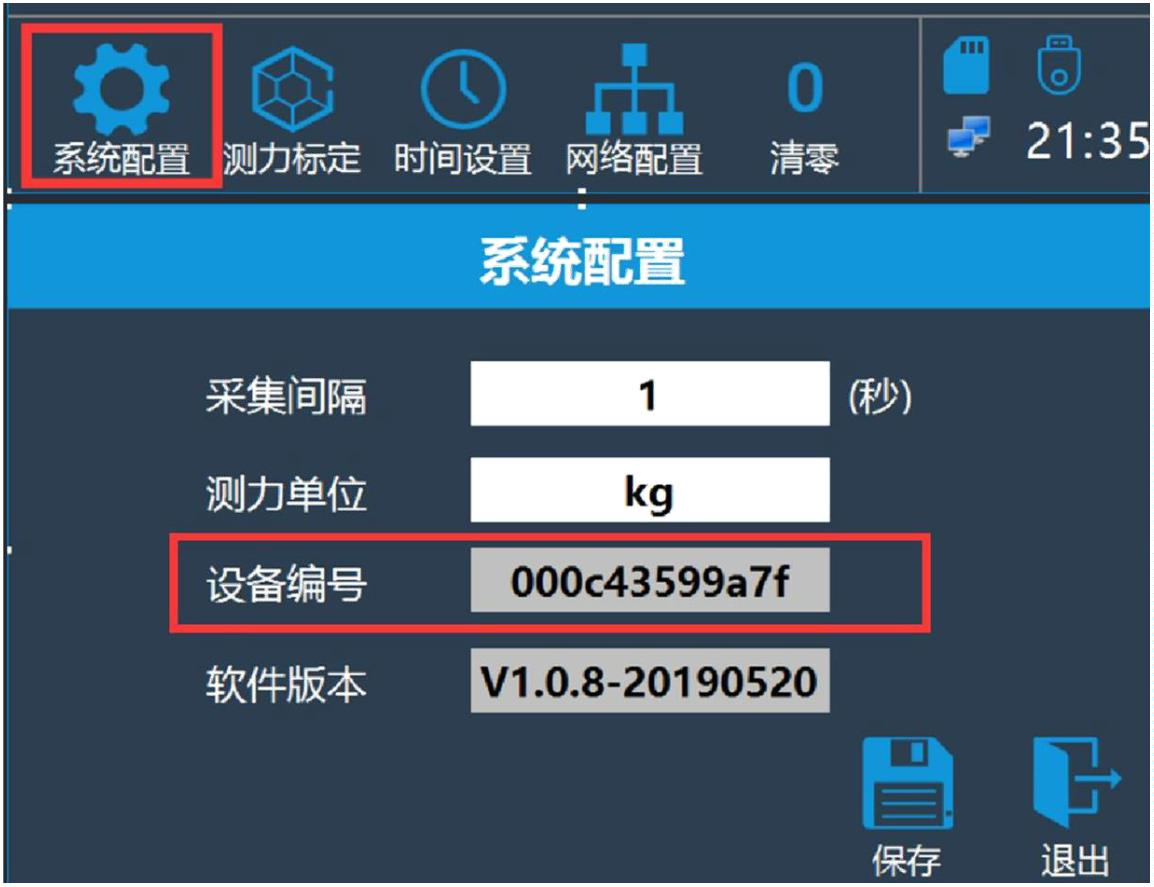
Click on "System Parameters" on the main interface to enter the system parameters page.
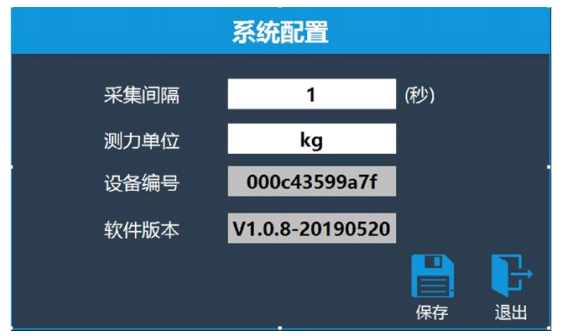
Sampling Interval: Set the number of seconds for the data collector to collect pressure data from all channels at regular intervals.
Force Unit: Set the unit of measurement for pressure display on the main interface.
Device ID: Each data collector has a unique device ID, which is used by the host computer to distinguish between different devices. This ID is a read-only parameter that cannot be modified and is built-in at the factory. Software Version: The software version number of the data collector and its release date. This information is also read-only and cannot be modified.
4.4 Force Calibration.
Before using the data collector, it is necessary to calibrate the pressure values for each channel. Currently, there are two calibration methods available: weight calibration and non-weight calibration. On the main interface, click on the "Force Calibration" button to enter the force calibration page.
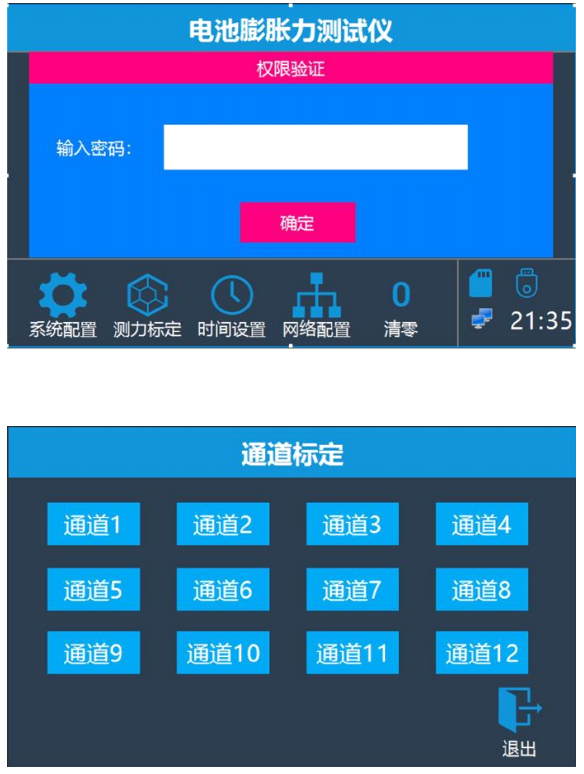
In the force calibration channel selection interface, select the channel number you want to calibrate.
4.4.1 Non-weight calibration.
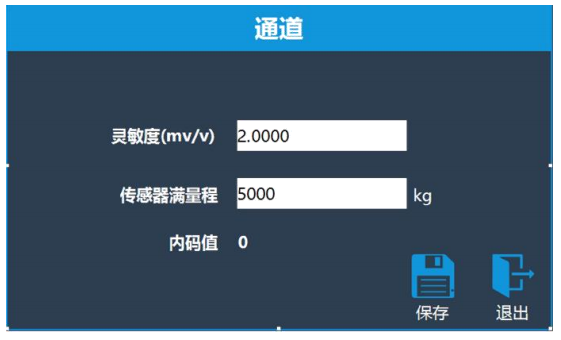
Sensitivity: The sensitivity of the sensor, measured in mV/V. Please enter the actual sensitivity of the sensor. Sensor Full Range: The full range of the sensor, please enter the actual full range of the sensor.
Digital Value: Read-only. It is used for debugging and to view the current instrument converted digital value. After clicking save, the non-weight calibration is completed.
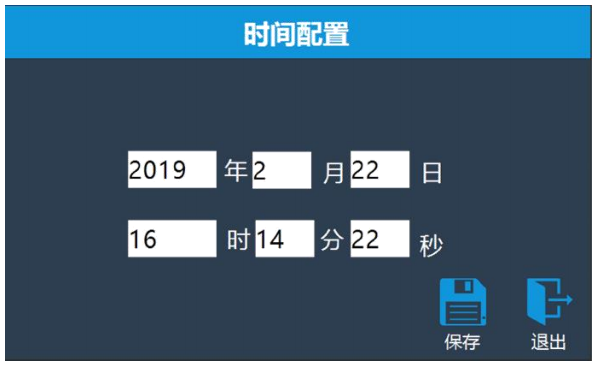
4.5 Time Calibration.
After the instrument is connected to the host computer software, the time on the instrument will automatically synchronize with the computer's time. In general, there is no need to manually set the time on the instrument unless there is no connection to the host computer software. To manually set the system time on the instrument, click on "Time Settings" on the main interface.
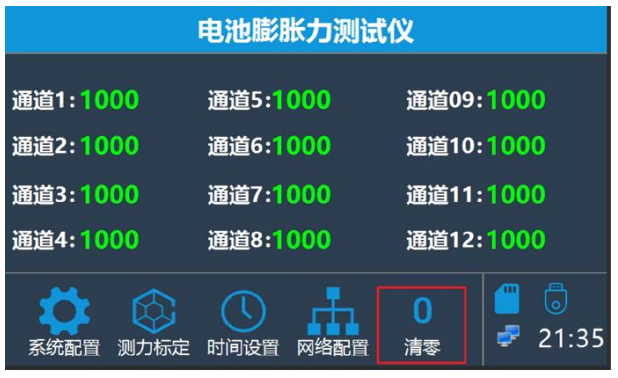
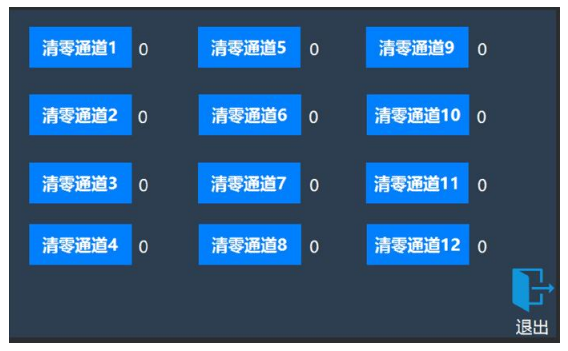
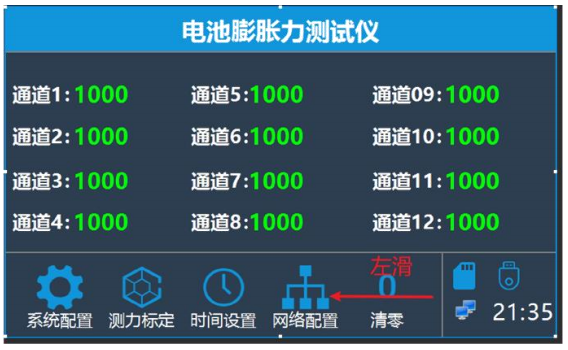
4.6 Zeroing.
In this interface, you can individually zero each sensor channel.
47 Export Data.
After detecting the insertion of a USB flash drive, the instrument will automatically save the collected data to the flash drive. However, before removing the USB flash drive, you need to click the export button to prevent data loss. To access the export button, swipe left on the bottom navigation icon with your finger.
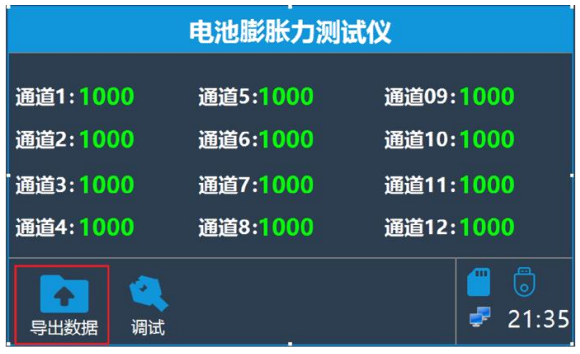
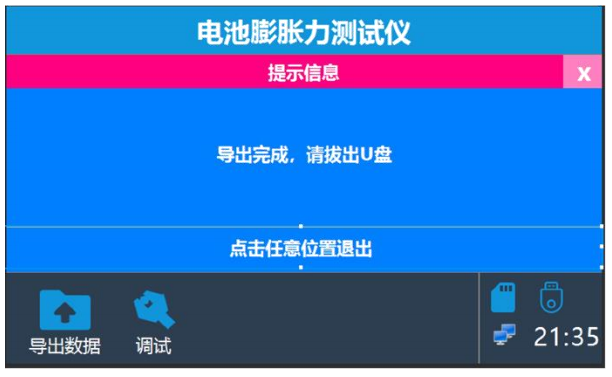
After clicking the export data button, the instrument will display a prompt with the export result once the export process is complete. It is important to wait for the successful result prompt before removing the USB flash drive.
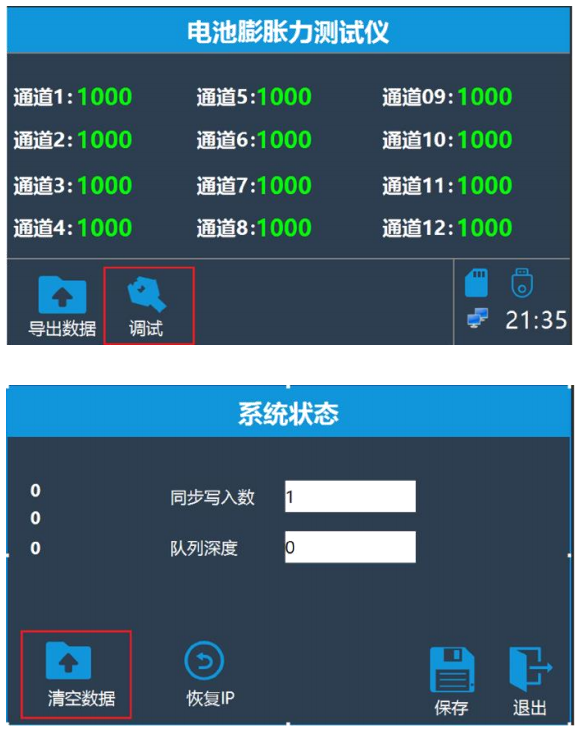
4.8 Debugging Function.
During the debugging stage, a large amount of data will be generated by the device. If the host computer software is not open, the data will be cached in the internal SD card of the device. Therefore, when the host computer software is opened, the cached historical data will be uploaded one by one. At this time, the pressure values displayed on the host computer software may differ from those displayed on the instrument. You can choose to clear these historical data to ensure that the host computer software displays the latest collected data.
5. Instructions for using the host computer software.
5.1 Software installation instructions.
Installation Steps
1. Unzip "Battery Swelling Force Testing System.zip"
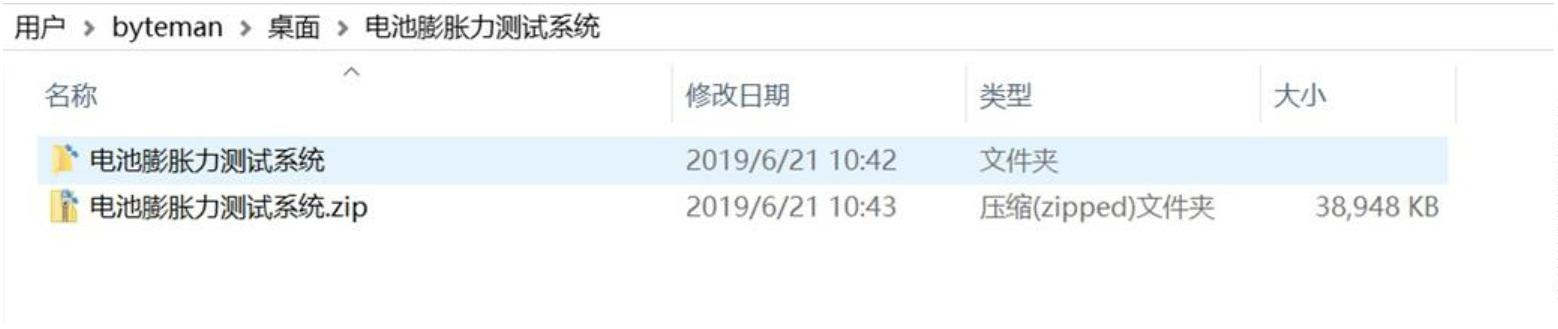
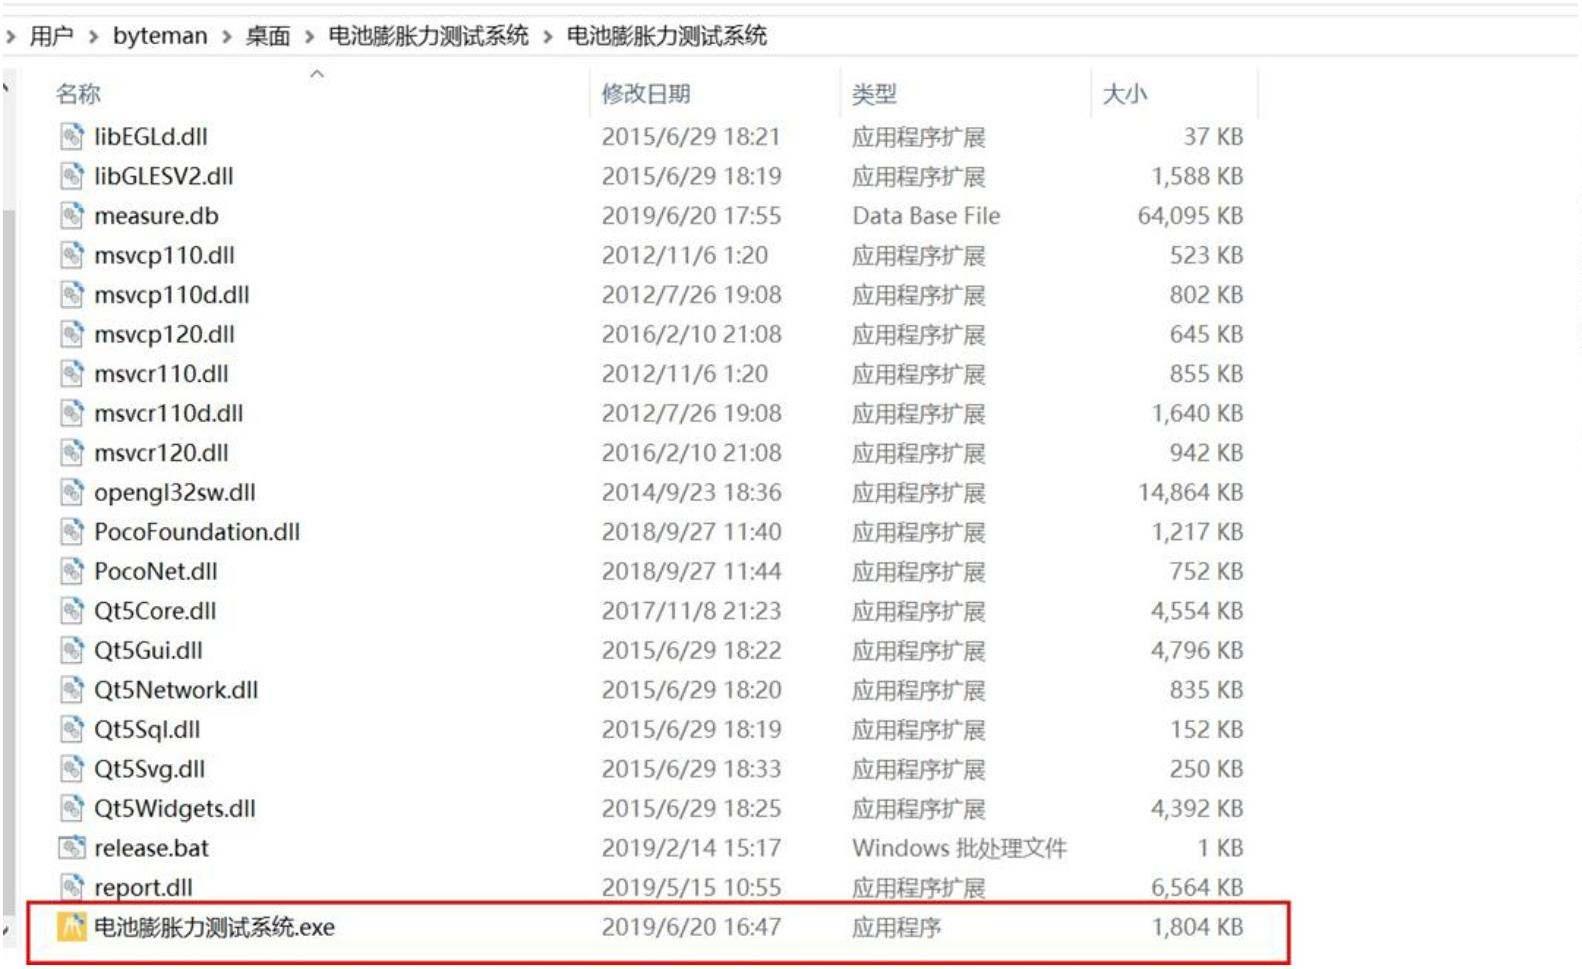
2. Go to the directory of the Battery Swelling Force Testing System that was extracted, and run the "Battery Swelling Force Testing System".
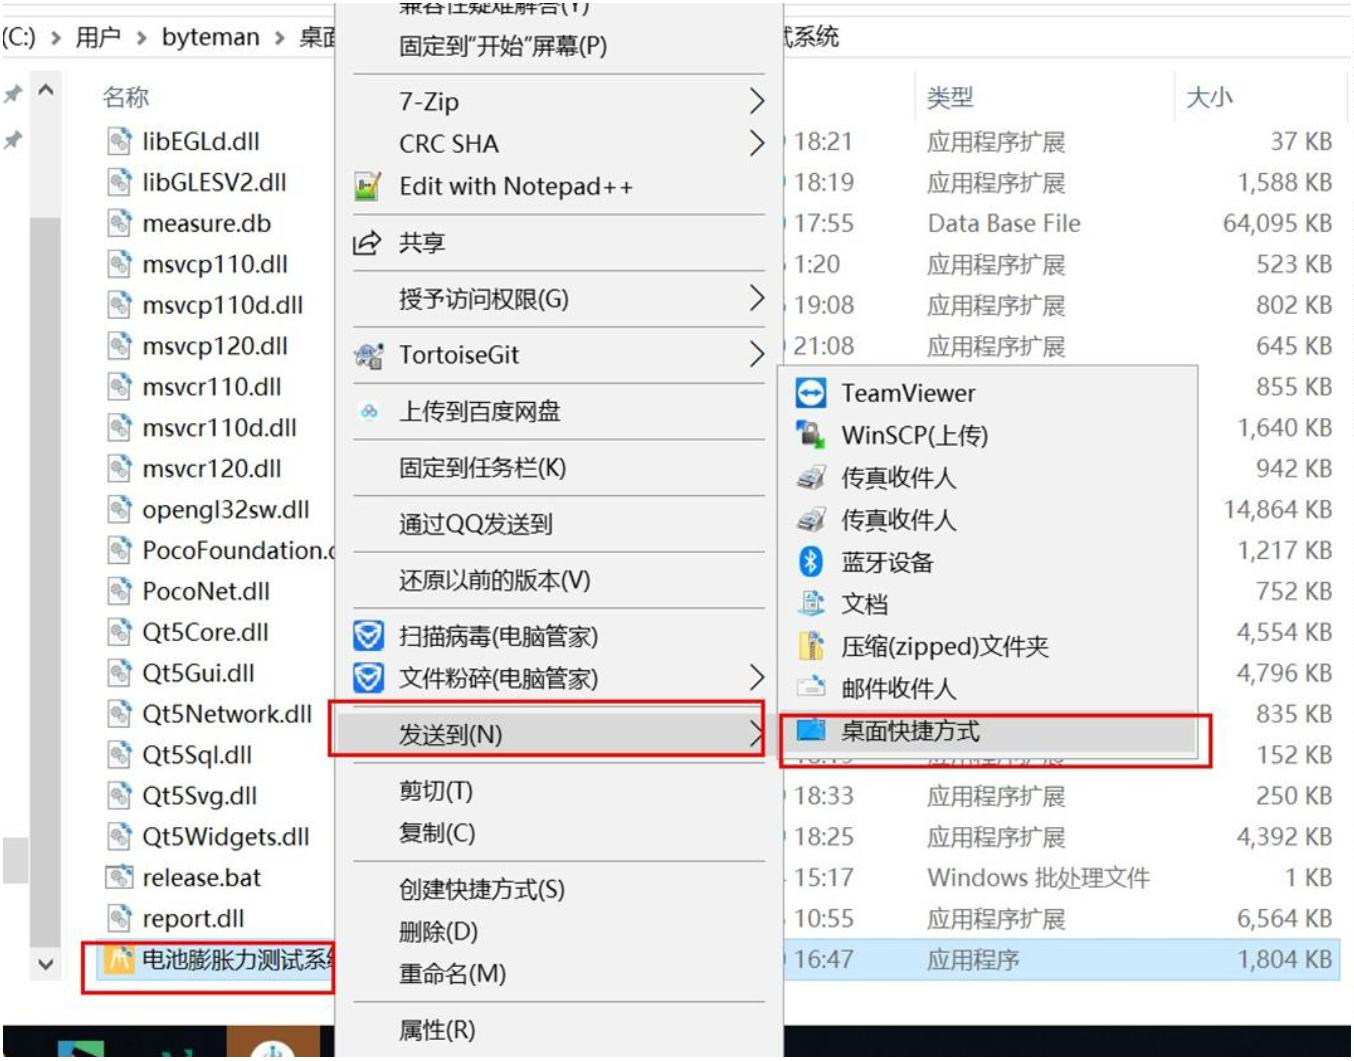
3. Create a desktop shortcut.
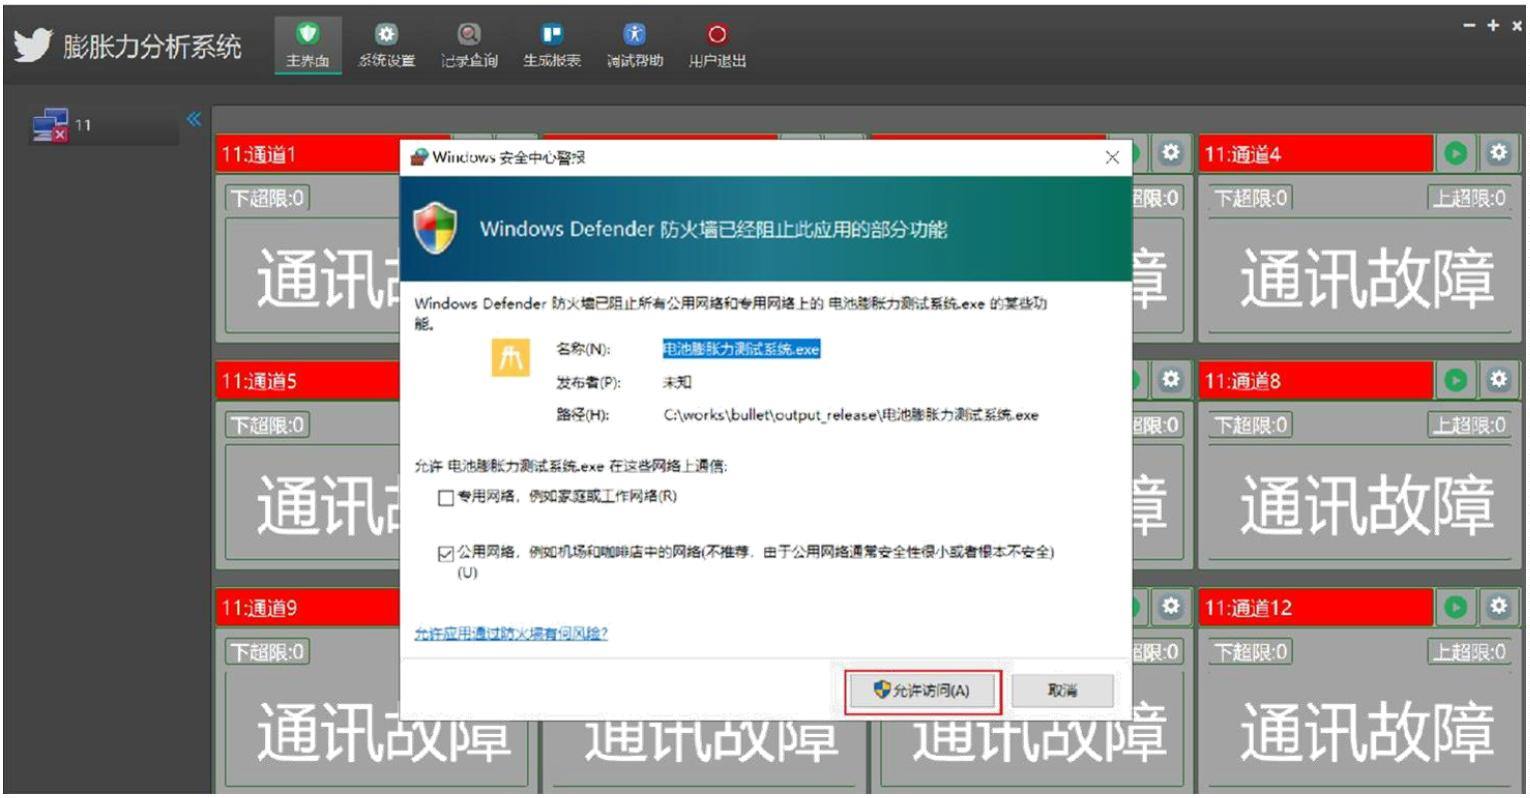
4. Double-click the "Battery Swelling Force Testing System" shortcut to run the program. In the first run, if the Windows system prompts whether to allow the software to access the network, please select the option as shown in the following image:
5.2 Software Configuration
5.2.1 Add Device
After the software is first unpacked and launched, if no devices have been added, it is necessary to add a device. Otherwise, the device sidebar on the left will be blank.
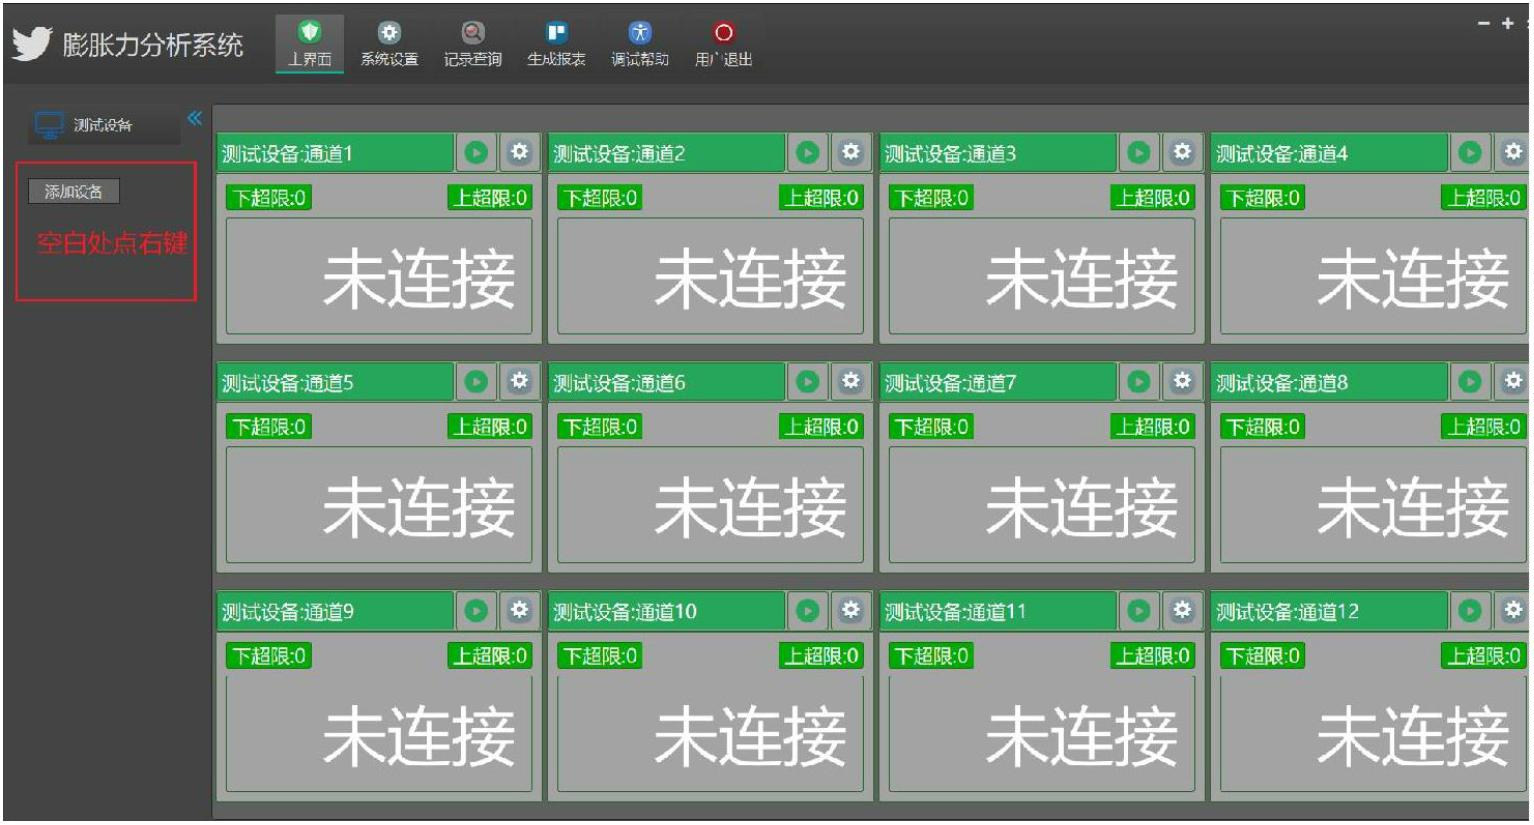
If you right-click on the blank space in the device sidebar on the left, an operation menu will pop up. Select "Add Device," and the software will prompt a "Device Configuration" dialog box.
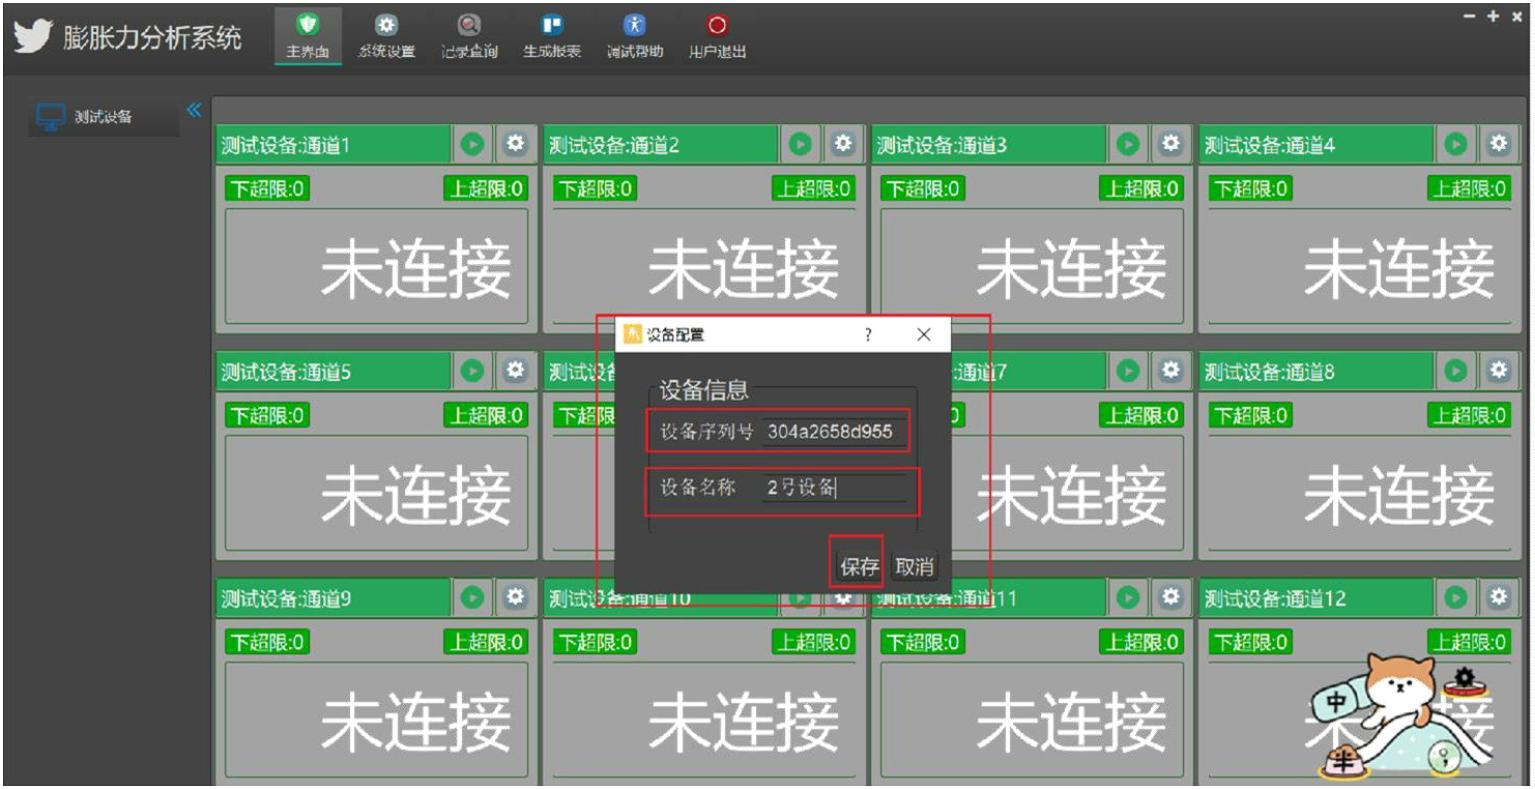
We need to enter the "Device ID" used to identify the device and the "Customizable Name" of the device. The "Device ID" can be found on the "System Parameters" interface of the data collector. Please fill in the device ID here.
Device Name: To make it easier for users to distinguish the device, you can assign a
memorable name to the device.
The device ID is like a person's identification number, while the device name is like a person's name.
Once the device is added, you will be able to see the newly added device in the device sidebar on the left.
5.2.2 Example Configuration
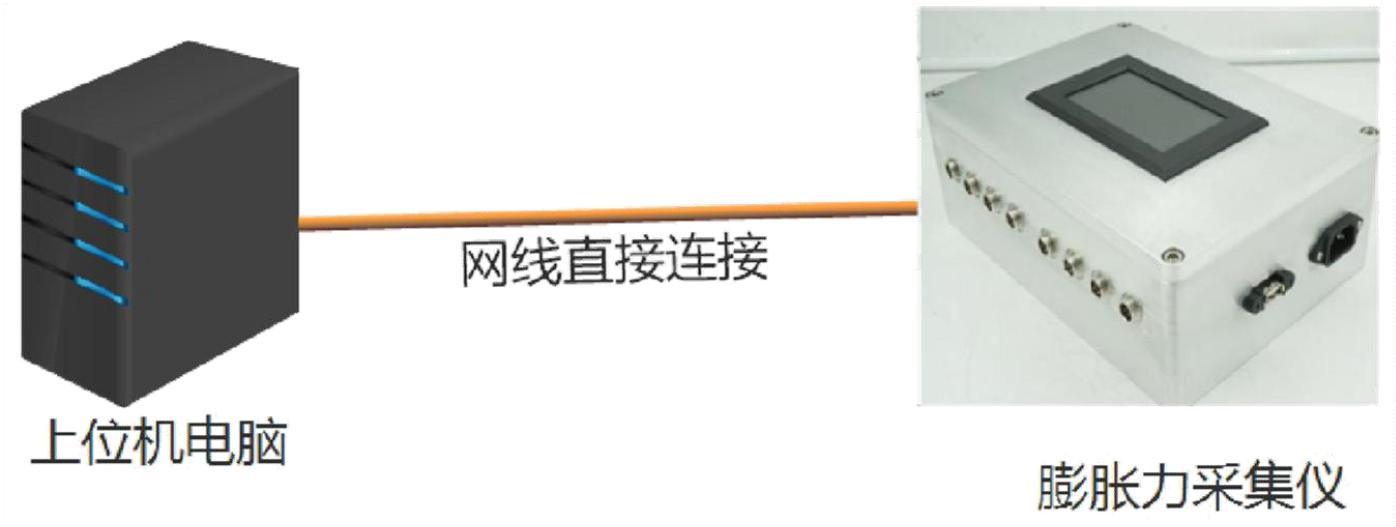
The following is the simplest configuration example for connecting a data collector directly to a computer. You can configure your computer and instrument's network parameters in this way:
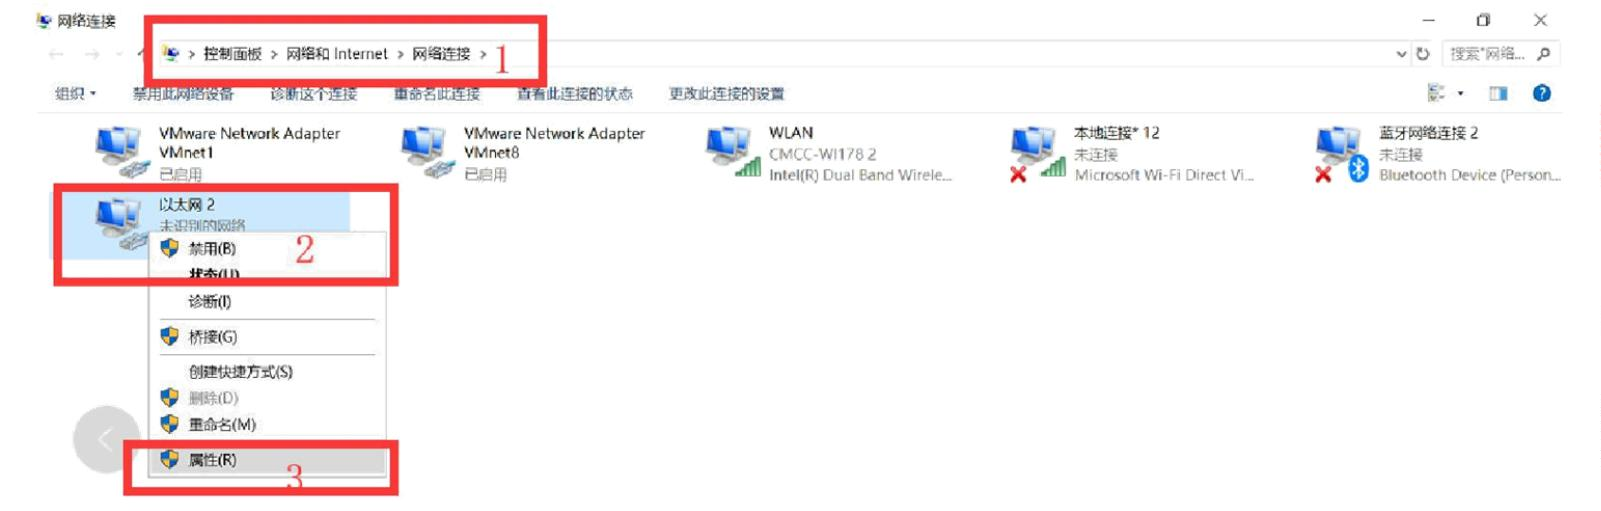
1. Configure the IP address of your computer to 10.1010.3 and the subnet mask to 255.255.0.0. To do this, follow these steps:
- Go to "Control Panel" -> "Network and Internet" -> "Network Connections".
- Find the network card that will be connected to the data collector, right-click on it, and select "Properties" from the context menu.
1. Configure the IP address of your computer to 10.10.10.3 and the subnet mask to .255.0.0. Follow these steps:
- Select "Control Panel" -> "Network and Internet" -> "Network Connections".
- Find the network card that will be connected to the data collector.
- Right-click on the network card and select "Properties" from the menu that appears.
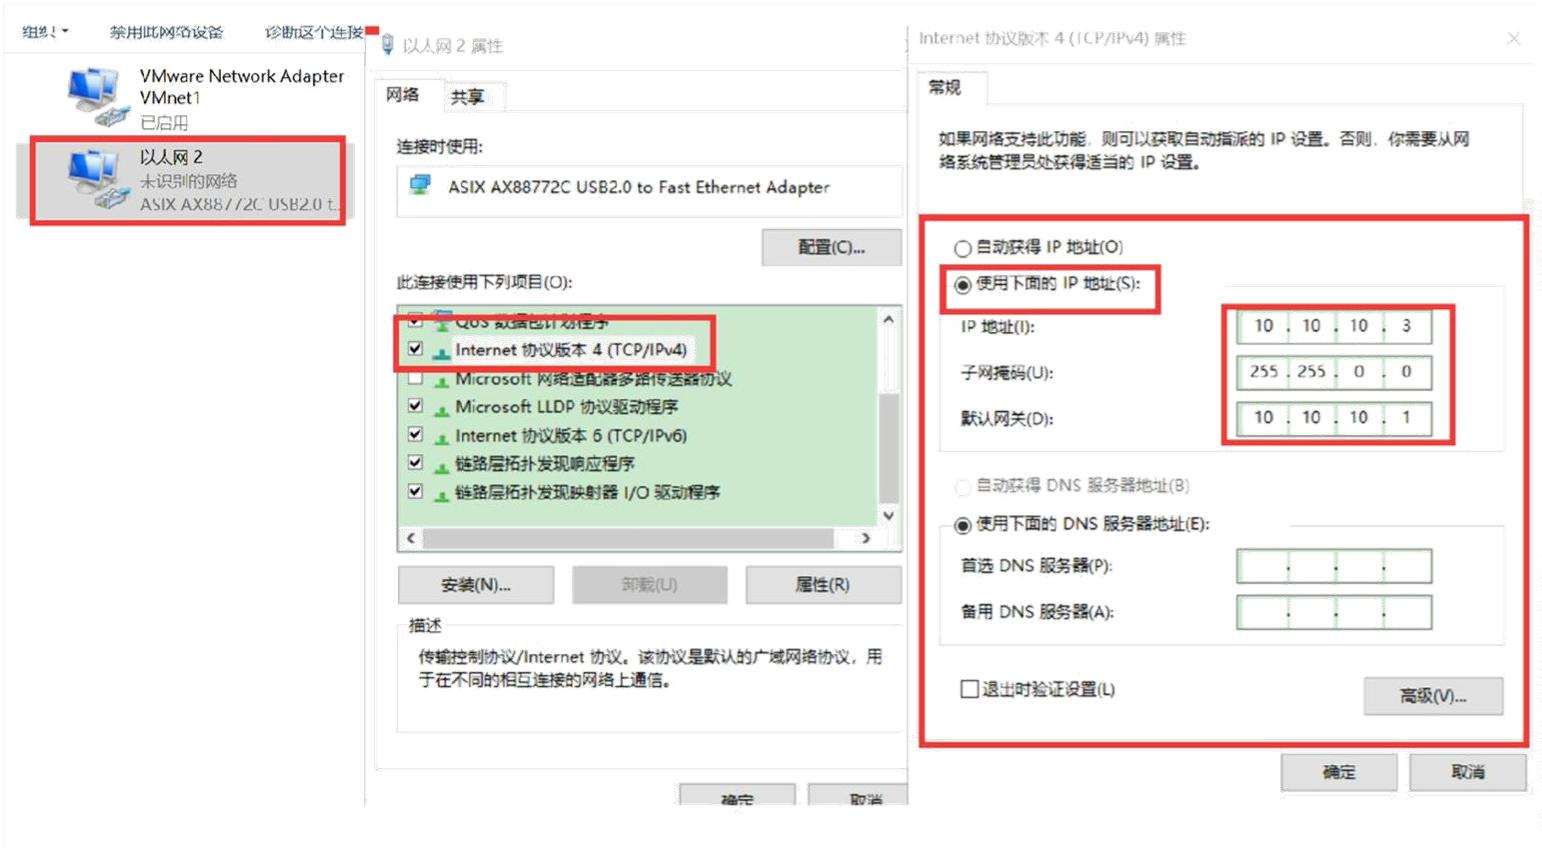
After clicking on "Properties", double-click on "Internet Protocol Version 4 (TCP/IPv4)" to configure the IP address.
2. Configure the IP address and server address on the data acquisition instrument. On the main interface of the instrument, click on "Network Configuration" to enter the network configuration page. Configure the instrument parameters as shown in the figure below. The MAC address does not need to be entered by the user as it is automatically generated during the manufacturing process. Once the settings are completed, click on "Save". If the network configuration of the instrument has already been set up as shown in the figure, there is no need to configure it again. Simply click on "Exit".
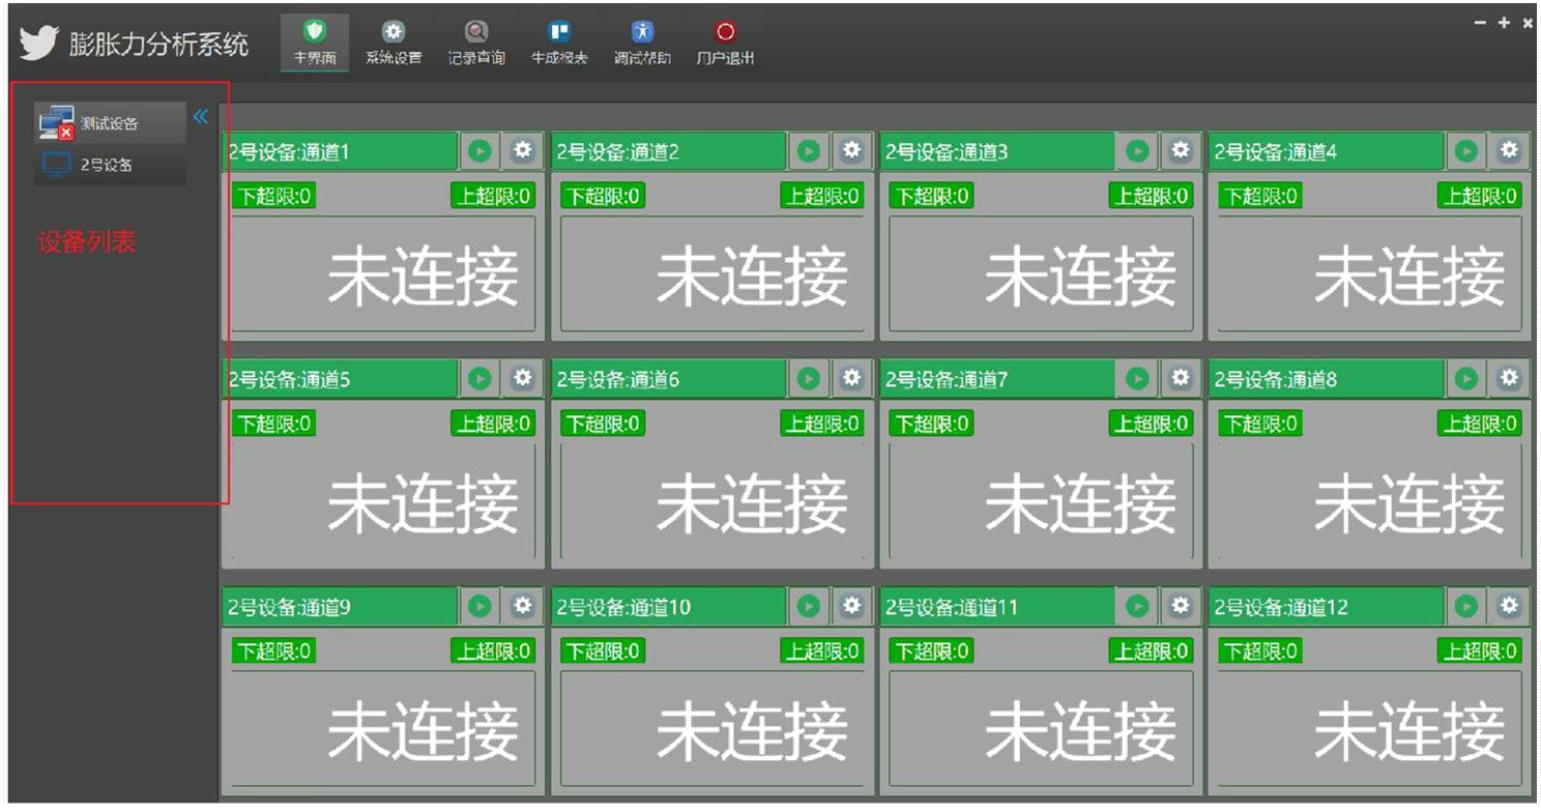
3. Once the instrument and computer software are successfully connected, the device icon on the left side will light up, as shown in the following image.
5.3 Software Usage
5.3.1 Real-time Viewing of Pressure Data
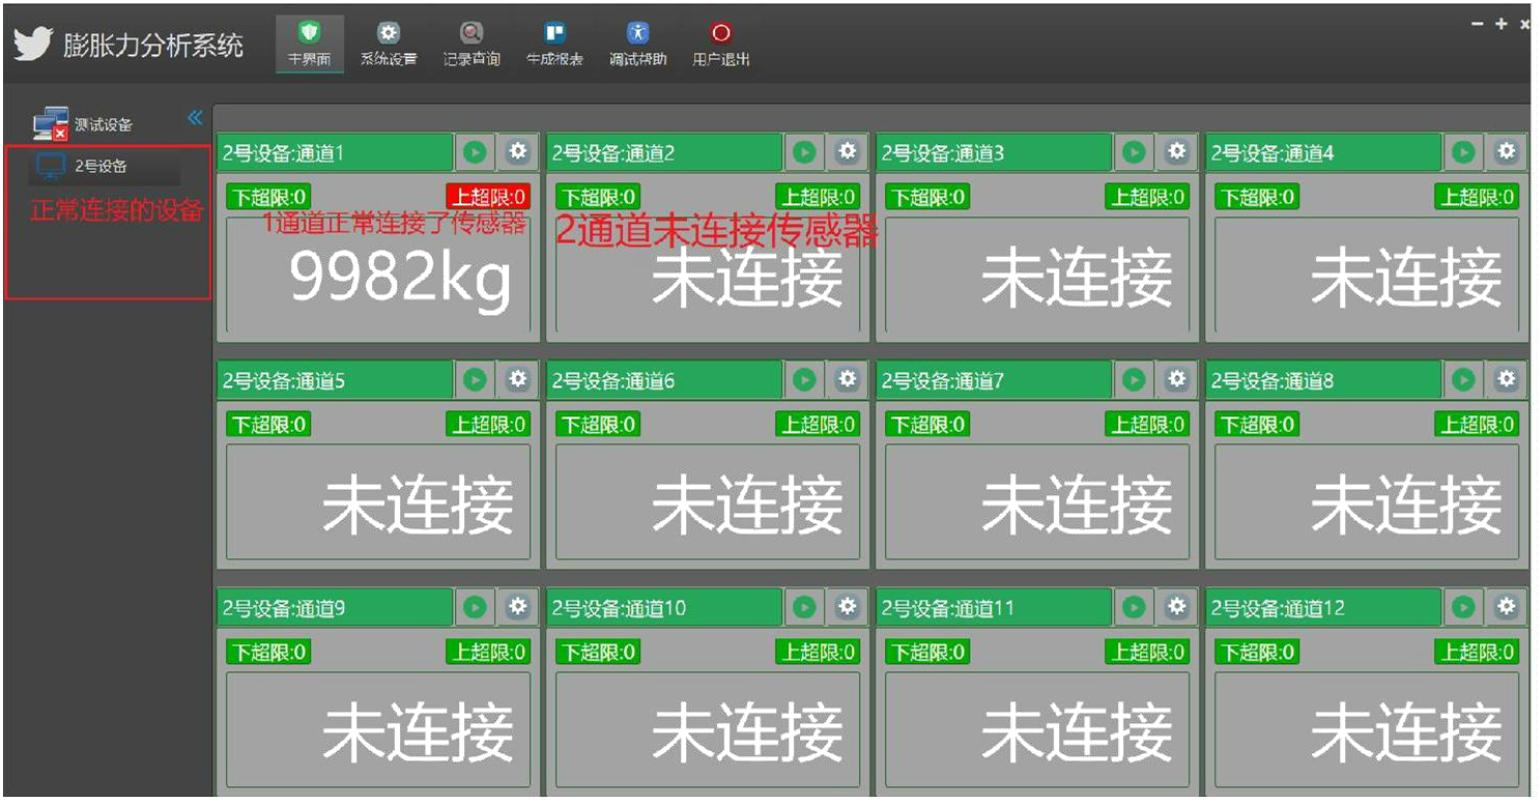
Once all devices are successfully connected, you can select the desired device from the device list on the left sidebar to view its data in real-time.
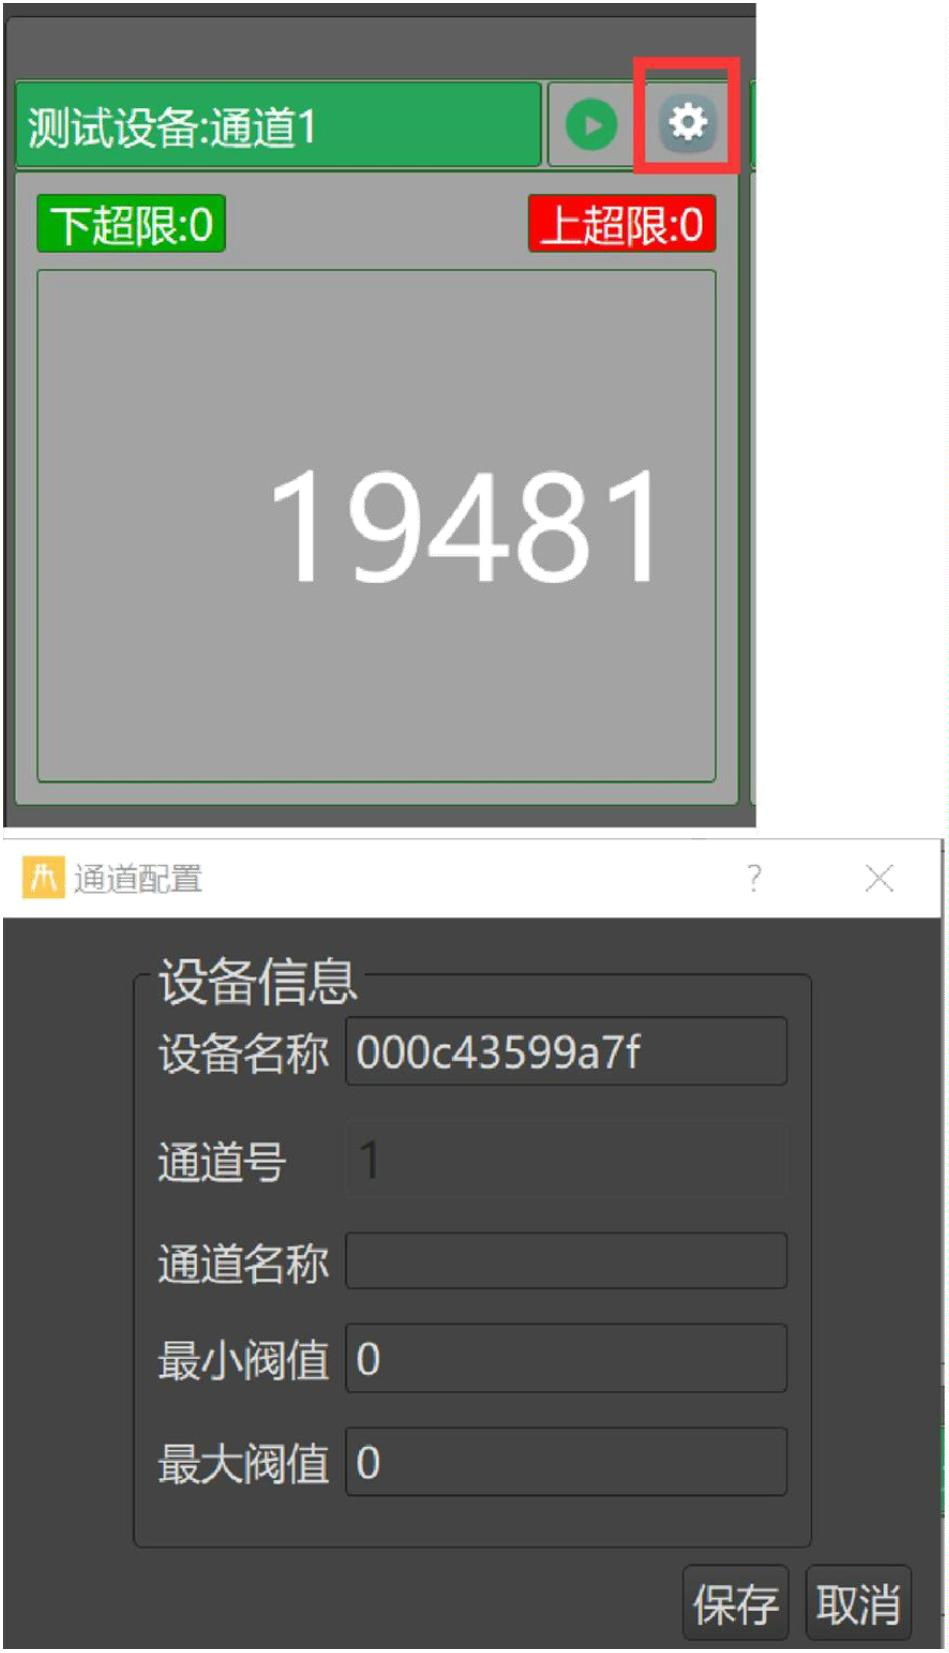
5.3.1.1 Pressure Channel Settings
Each channel of every device can be configured with settings such as upper and lower pressure limit alarm parameters and channel names.
Channel Name: You can assign a recognizable name to each channel.
Minimum Threshold: This is the lower limit threshold for pressure.
Maximum Threshold: This is the upper limit threshold for pressure.
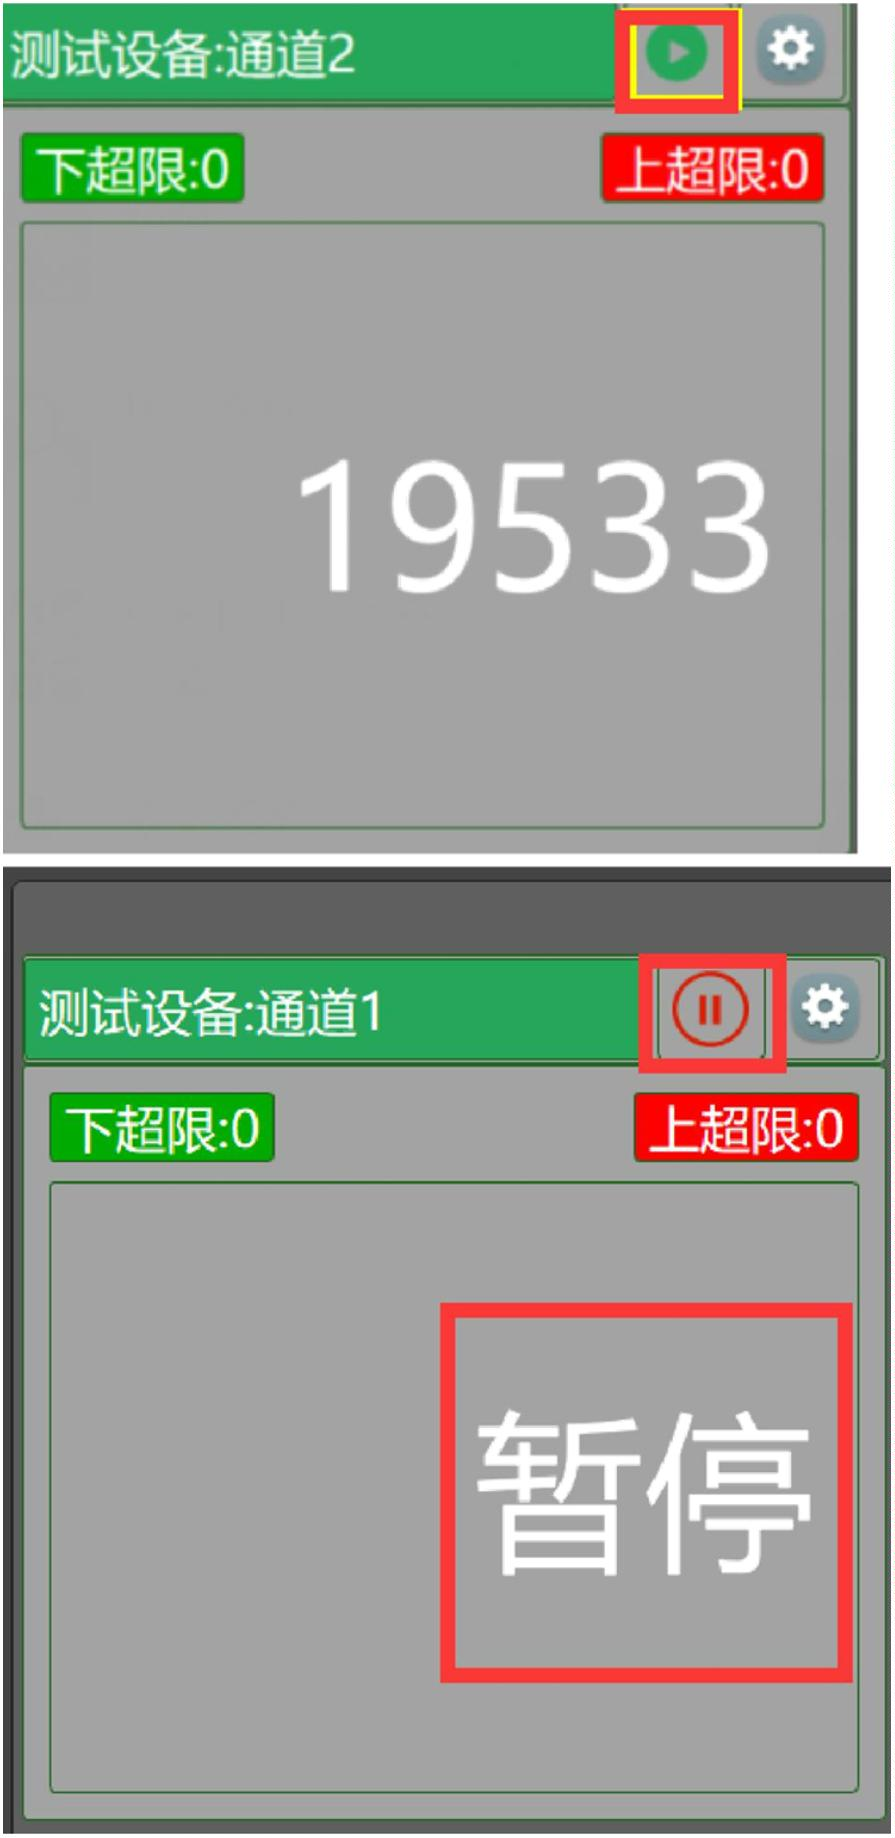
When the pressure goes beyond the maximum or minimum threshold, corresponding alarm prompts will be generated on the channel interface.
5.3.1.2 Pause and Resume Storage of Channel Pressure Data
The data of each pressure channel of the device can be configured to pause storage. Click the pause button on the channel interface, and the channel will enter a paused state of data reception.
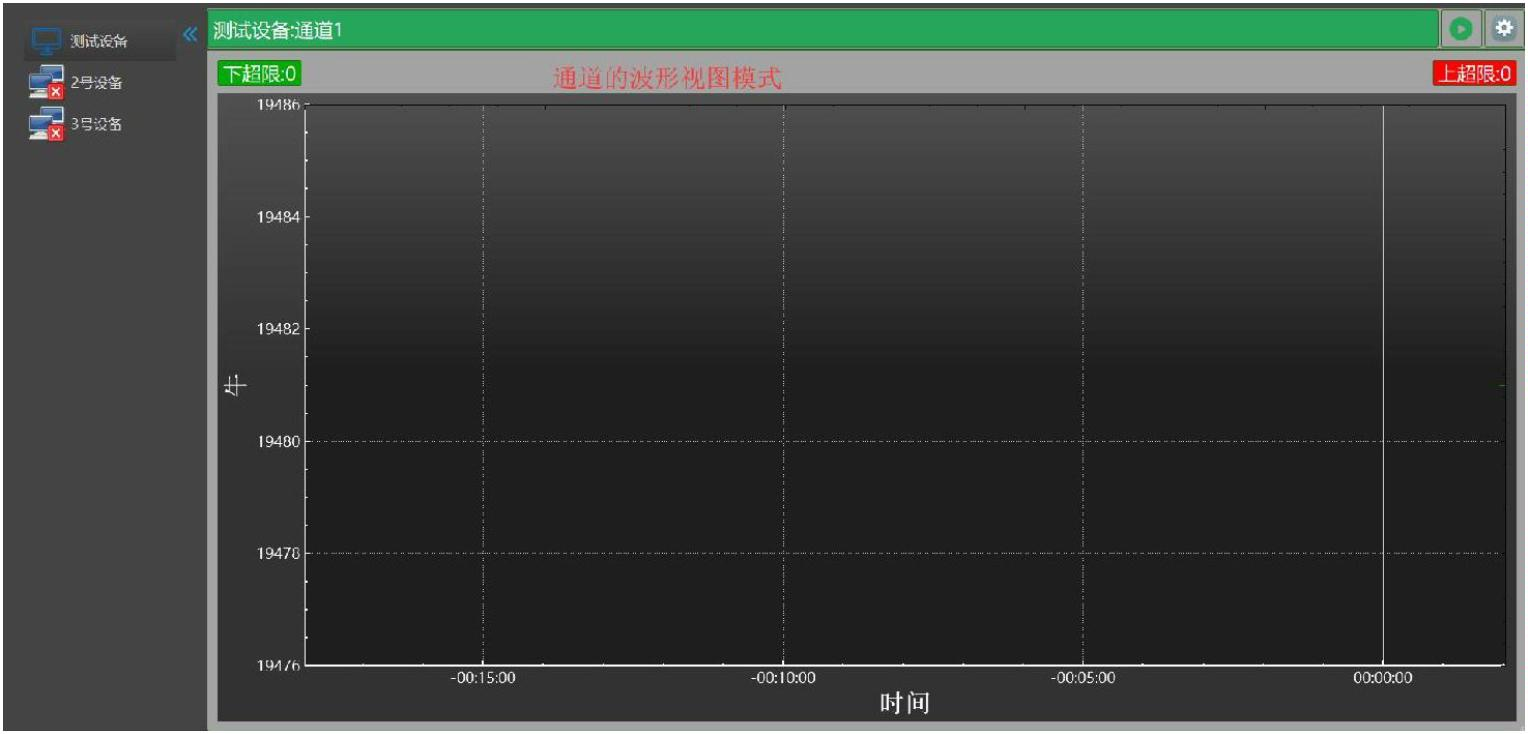
5.3.1.3 Real-time Waveform of Channel Pressure Data
Double-click on a specific channel with the mouse to switch to the real-time waveform view of the pressure data for that channel. The waveform graph will display upper and lower limit indicator lines. Double-clicking on the title bar of the waveform view will switch back to the data view interface.
5.3.2 Historical Pressure Data Query
Click the "Record Query" button on the top navigation menu to enter the historical pressure data query interface.
5.3.2 Historical Pressure Data Query
Click the "Record Query" button on the top navigation menu to enter the historical pressure data query interface.
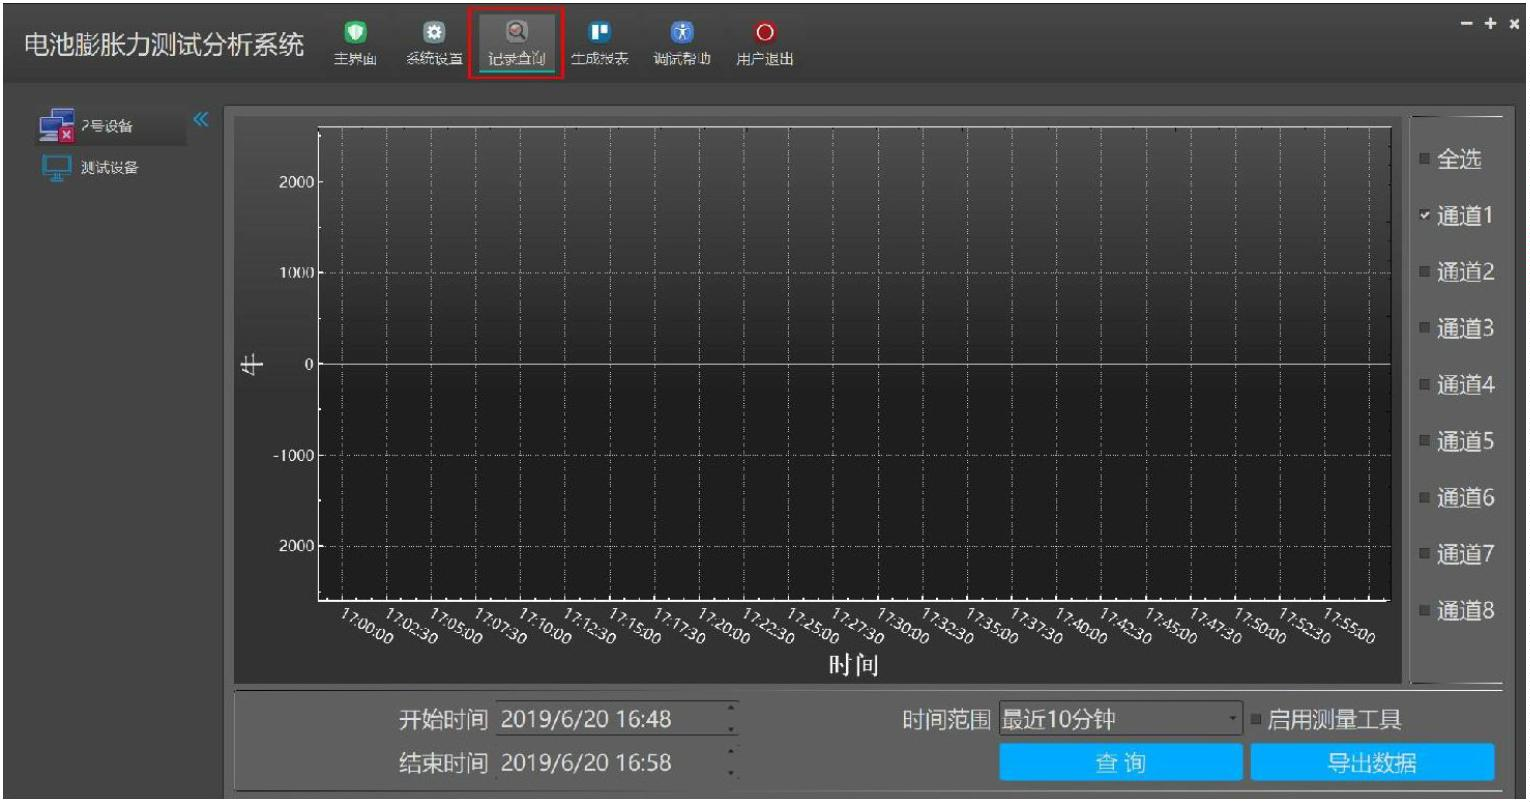
Here, the historical query is also based on the device and channel.
1. First, select the desired device from the device list on the left sidebar.
2. Then, select the channel(s) from the channel selection box on the right side. You can select single or multiple channels.
3. Select the start time and end time for the historical data that you want to query.
4. Click the "Query" button.
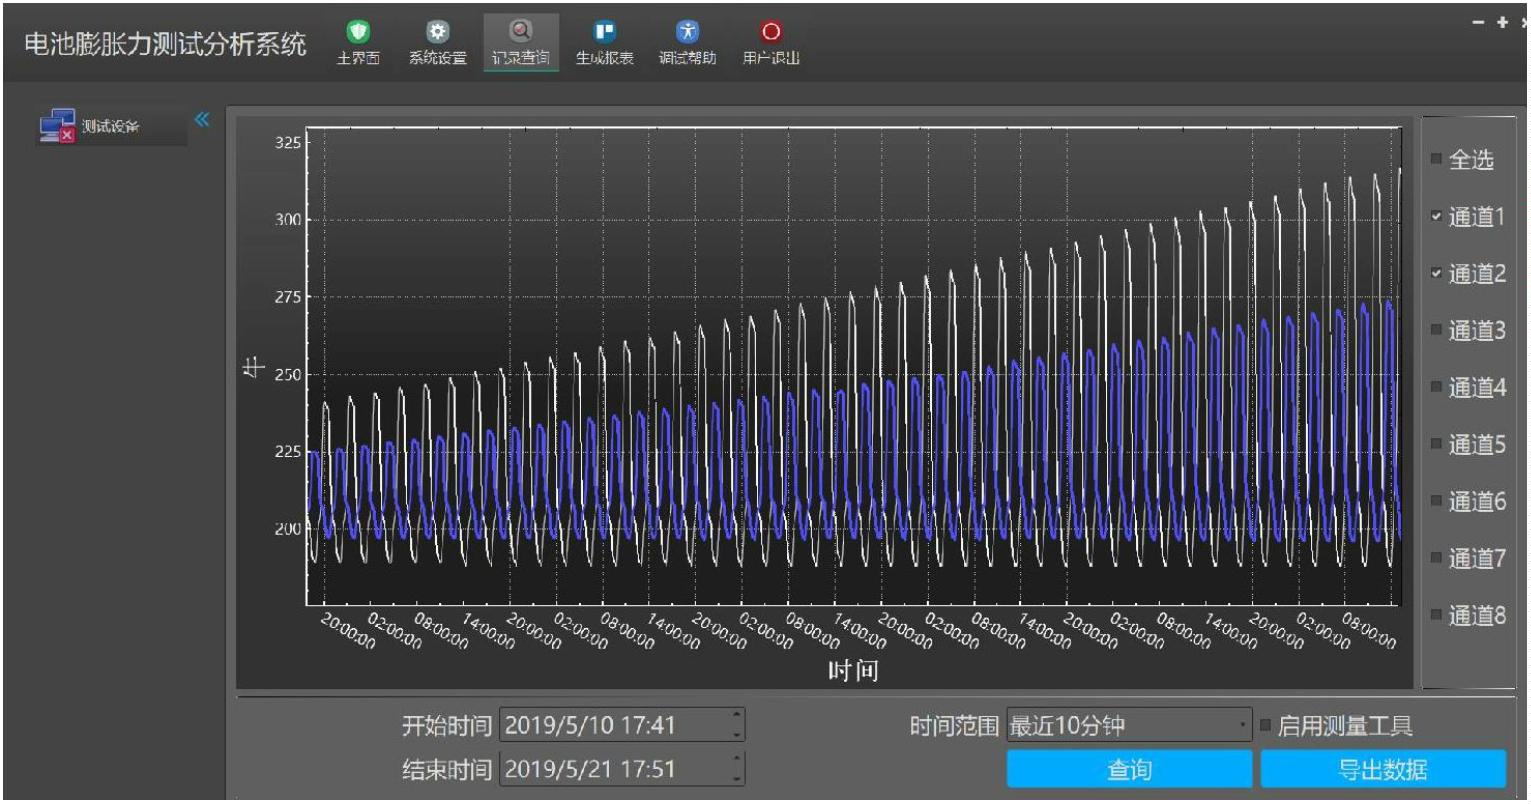
上图是测试设备 1,2 通道的 2019/5/10 到 2019/5/21 号的历史数据
5.3.2.1 Historical Data Export
The software also supports exporting the queried results as CSV data. After clicking the "Export Data" button, you can enter the desired file name and path for exporting. The data will then be exported as a CSV file format.
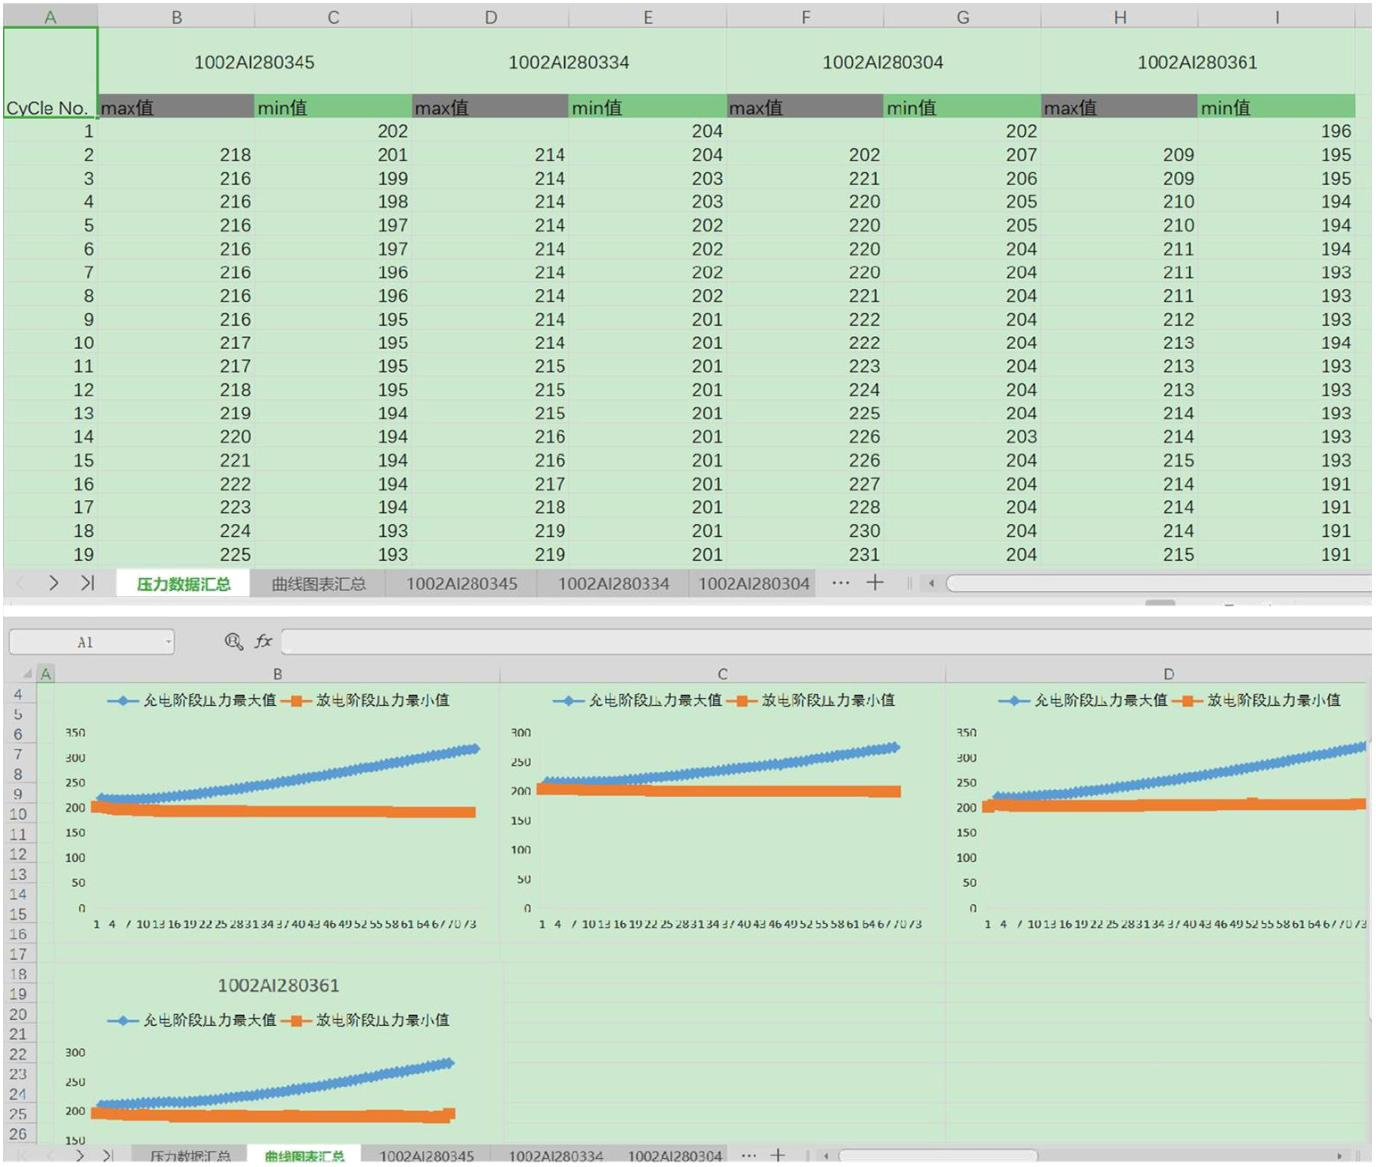
5.3.2.2 After querying the historical data of the curve operation tool, you can use the mouse to zoom and move. After clicking the "Enable Measurement Tool" button, the mouse can track and measure the time and pressure values of the current position in real-time. Holding down the right mouse button and dragging will pan the curve. Scrolling the mouse wheel up and down will zoom in and out of the curve, zooming in on a specific area. After selecting a certain region with the left mouse button, the software will analyze the maximum pressure value during the charging phase and the minimum pressure value during the discharging phase for each cycle, and finally generate a pressure test report.
5.3.3 Generating an order cell pressure test report. This feature is customized based on the customer's specific business. If your business-related data does not match the description below, please do not use this feature. The customer will record the cell numbers, test temperature, and corresponding pressure equipment and channel numbers for each test order in a file called "Pressure Status Table". The software supports automatic analysis of the orders in the pressure status table and all cell numbers under each order. Based on the cell numbers, it will automatically match the charge-discharge files of the battery management system. The software will analyze the time periods for each charge and discharge cycle, find the maximum pressure value during the charging phase and the minimum pressure value during the discharging phase for each cycle, and finally generate a pressure test report.
Operation steps:
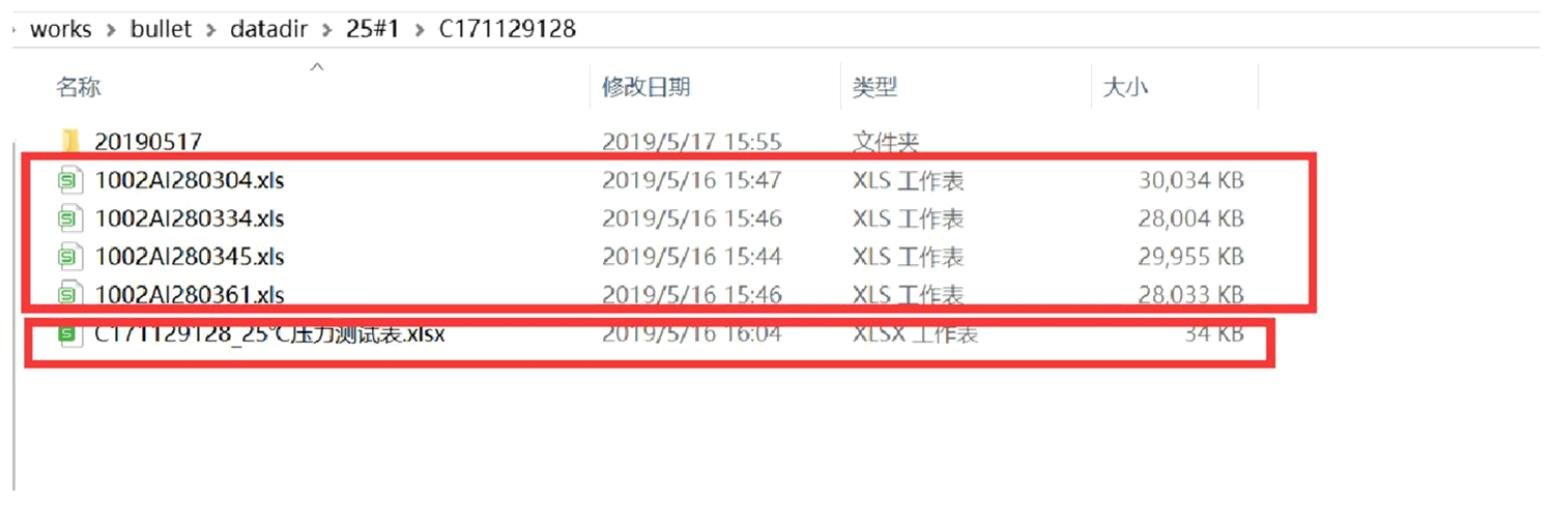
1. Select the directory where the battery management system files are located. The directory must contain the "Pressure Status Table.xlsm" file.

After selecting the control cabinet directory, the software will automatically analyze the "Pressure Status Table.xlsm" file in that directory. It will list all orders and you can click the "Generate Report" button corresponding to each order to generate a pressure test report in the directory where the order is located.
Pressure status table:

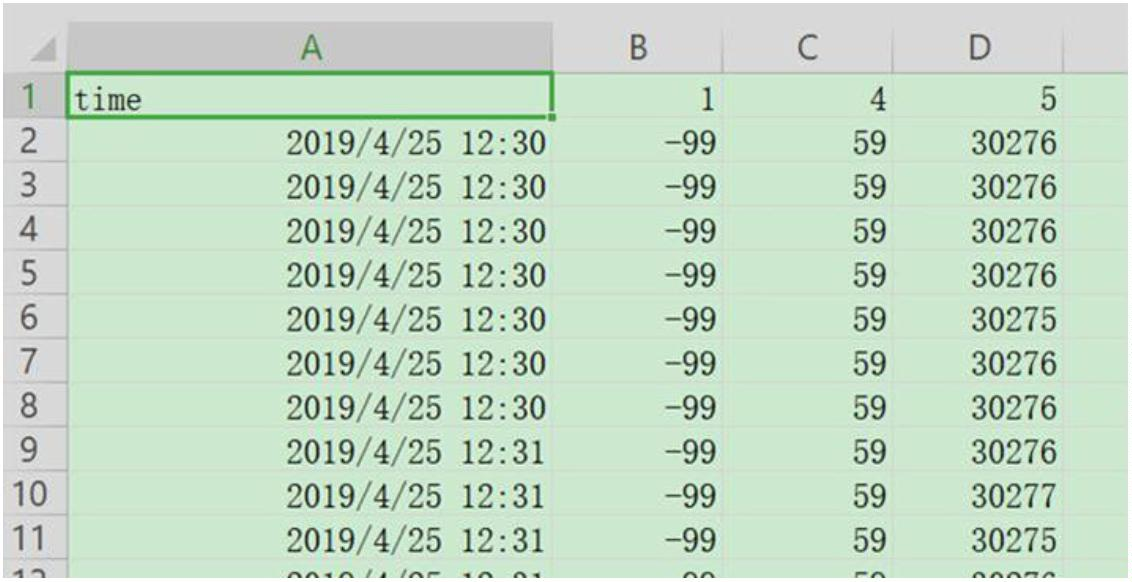
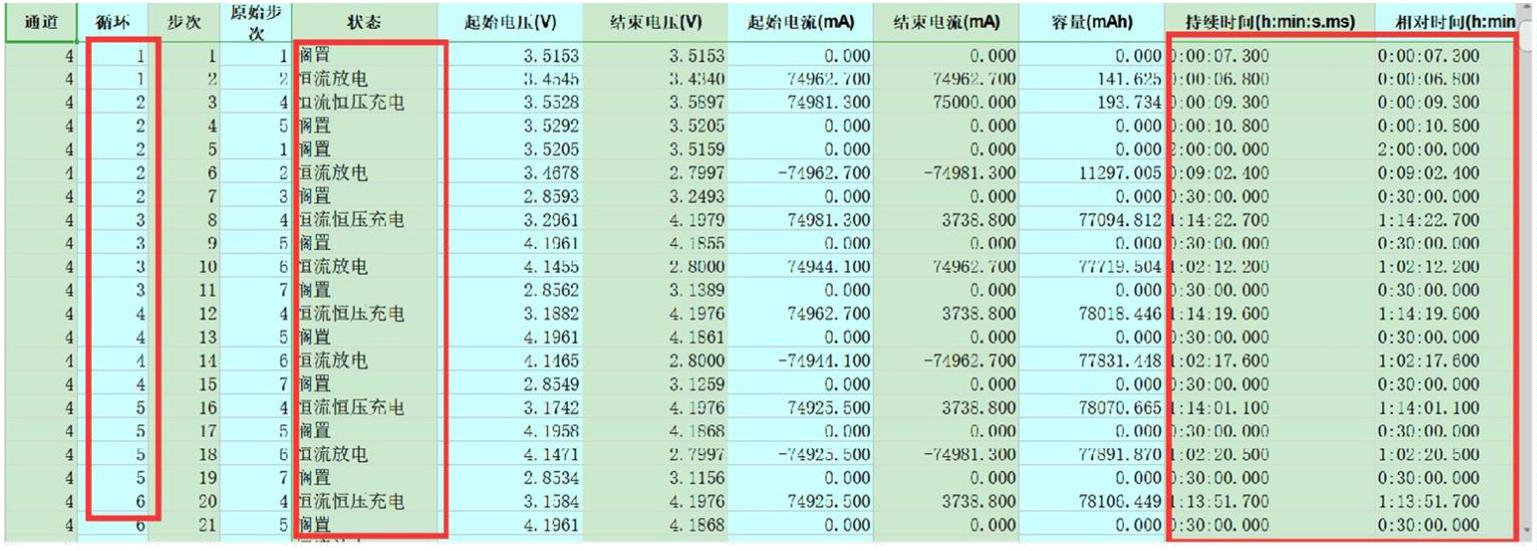
Battery management system data
Pressure Testing Report
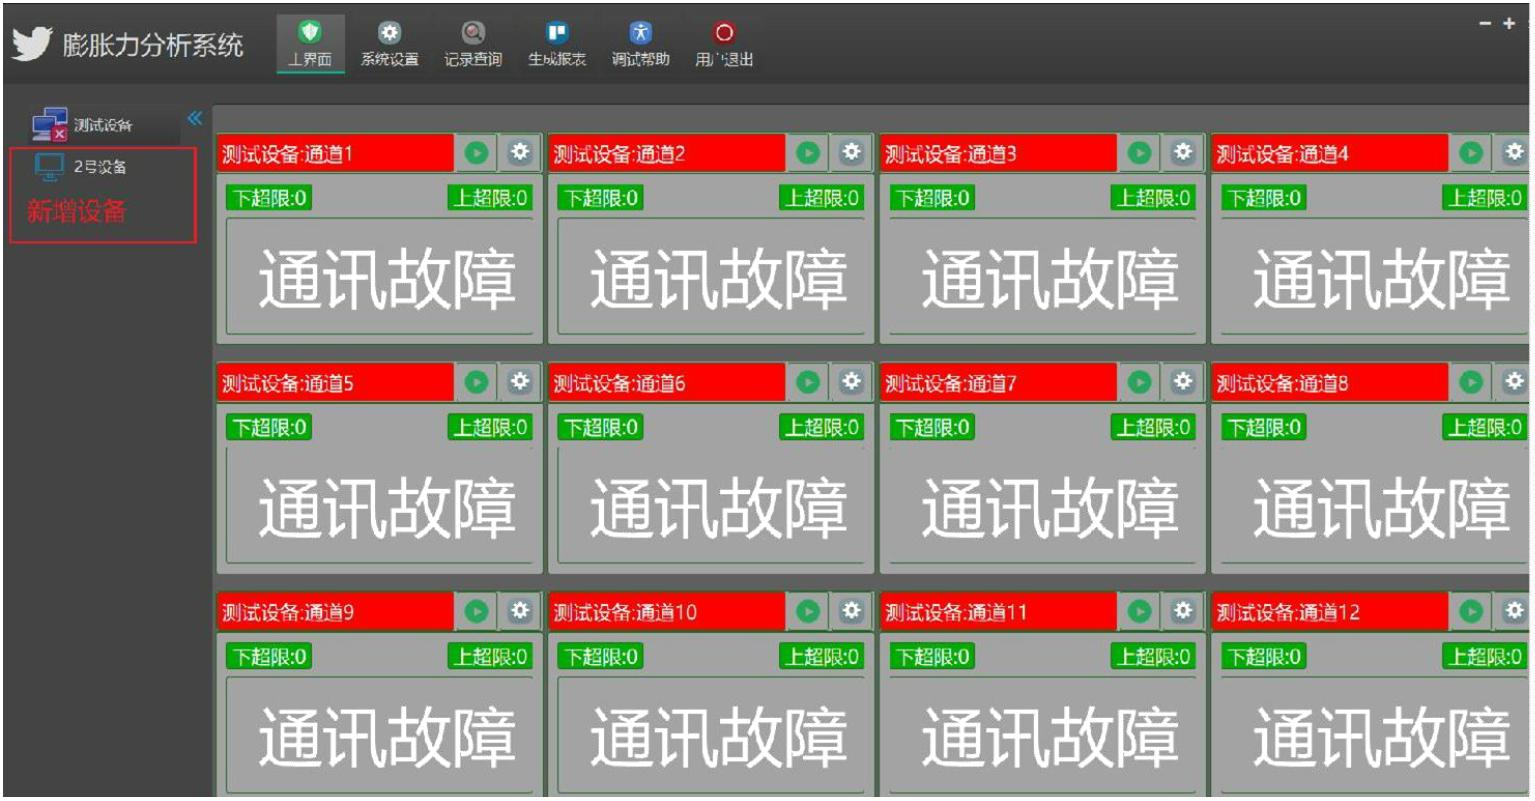
3.4 Common error messages
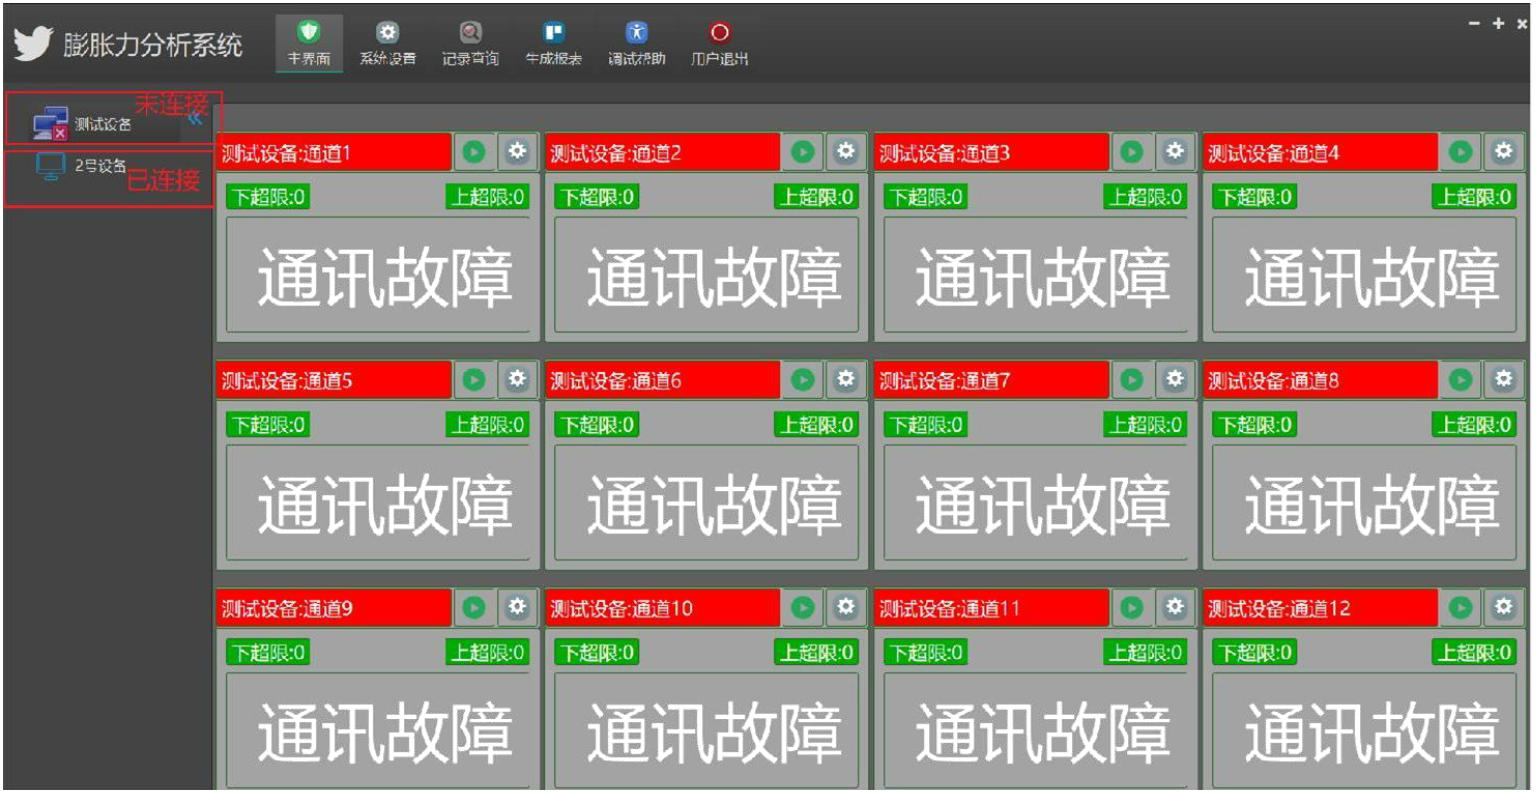
1. Failed network connection between the device and the host software [Communication failure]. You can see an [x] symbol on the connection icon of the device in the left device panel, indicating that the device is not connected to the computer. The message "Communication failure" will be displayed on each channel on the right side.

Check if the equipment number on the instrument matches the device number added in the software. The logs of the host computer can also provide hints.
The software is launching.
2. A pressure channel is not connected to a pressure sensor.
3. Channel Pause
6. Equipment Maintenance
6.1 Equipment Inspection and Maintenance:
● Regular maintenance is required for the instrument. Basic checks should be conducted on the equipment weekly, and comprehensive maintenance should be performed monthly. In daily operations, it is important to keep the equipment clean. Regular dust removal can be done using a dry cloth, towel, or soft brush. Before use, inspect the appearance of the sensors for any damage. The instrument should be placed in an appropriate environment, preferably a dry, clean, sun-shielded, and interference-free area. Handle the instrument with care to avoid damage from accidental impacts. Check if the aviation plugs of each channel are properly connected, and inspect the installation and power status of the equipment.
● Regularly evaluate the conditions of the operating and storage environments of the equipment, and take appropriate measures for dust prevention, temperature regulation, dehumidification, corrosion prevention, pest control, and shock resistance, as necessary.
● All instruments should undergo regular mandatory calibration and self-checks. If any defects are detected during calibration/calibration or other means, the instrument should be immediately taken out of service for repairs before being put back into use.
6.2 Precautions:
● Before using the monitoring equipment, establish standard operating procedures and usage rules and keep them near the instrument. Clearly define the responsibilities for use, storage, and maintenance, and ensure that operators are trained and qualified before operating the equipment. ● Necessary isolation measures and warning signs should be in place when operating safety-related instruments. Develop maintenance personnel and maintenance schedules based on different instrument characteristics. Regular maintenance and relevant records should be maintained. ● Operators must strictly follow the operating procedures and avoid overloading. They should be familiar with the structure, principles, operational procedures, and precautions of the instrument to prevent damage due to misoperation. The instrument should be placed in an appropriate environment, preferably a dry, clean, sun-shielded, and interference-free area. Handle the instrument with care to avoid damage during handling. ● Maintenance and care of monitoring instruments are integral to the proper functioning of the sensors. Disassembling the equipment should not be done casually. Proper maintenance and care of the instrument are crucial for its performance and success rate of monitoring. In practical operations, it is necessary to have a general understanding of equipment maintenance and care and perform relevant maintenance and care work.

Room B612-59, No. 91 Hanjiang West Road, Xinqiao Street, Xinbei District, Changzhou City, Jiangsu Province, China